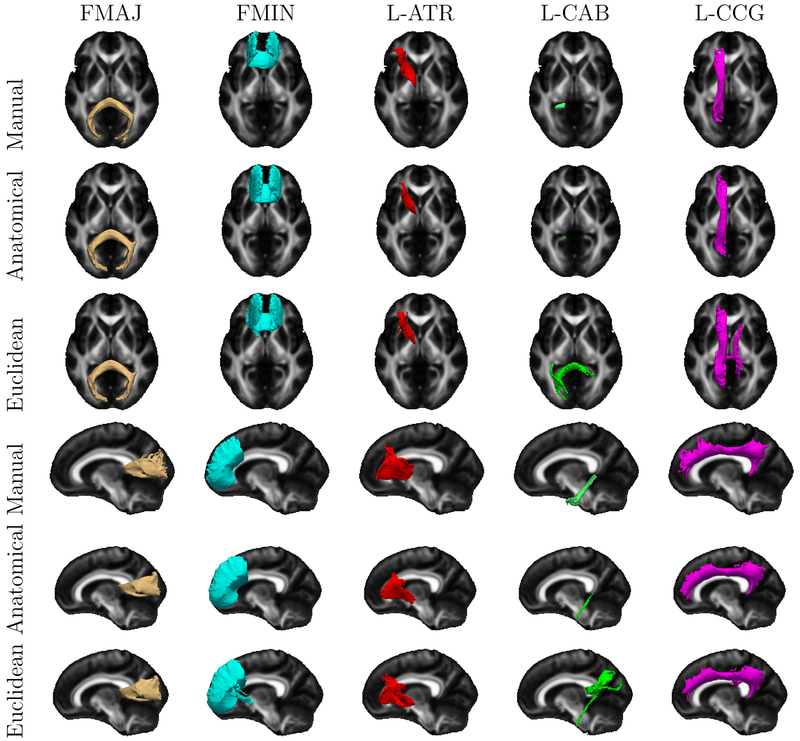
Figure 5:
Population averages of the manually labeled bundles and the streamline clusters that contain more than 5% streamlines overlapping with the corresponding manually labeled bundle. Each color represents a different WM pathway. The population averages across all subjects are shown as isosurfaces in axial and sagittal views.

