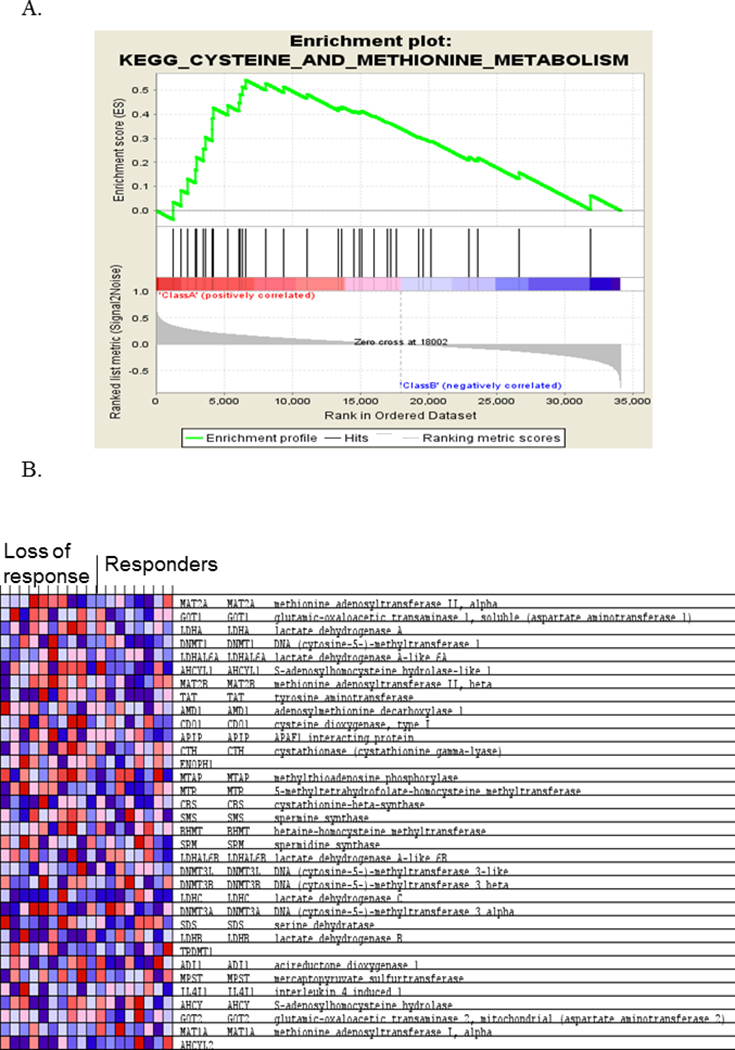
Figure 2.

Loss of responders to anti-TNFα therapy exhibit dysregulation in the cysteine and methionine metabolism pathway. Gene set enrichment analysis was performed from the colonic gene expression data obtained from Crohn’s disease (CD) patients with loss of response compared to CD patients in remission while on anti-TNFα. (A) Genes in the cysteine and methionine pathway were most represented in the enrichment analysis, leading to an enrichment score (ES) of 0.59. (B) Heatmap of genes including in the cysteine and methionine pathway, per the KEGG database. Red color represents relative over-expression, while blue color represents under-expression.
