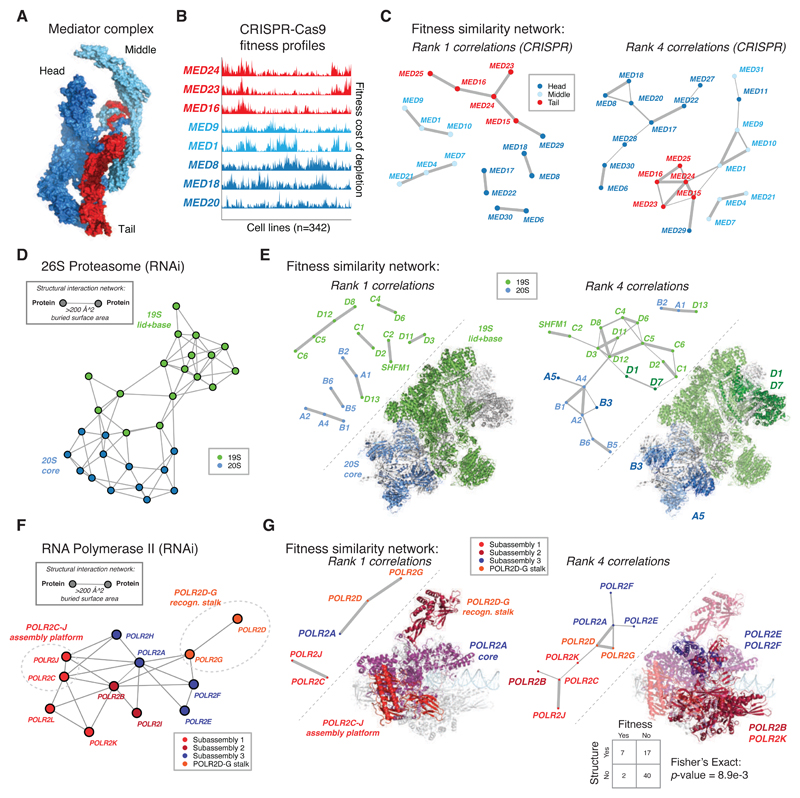
Figure 3. Fitness correlation networks highlight functional modules of protein complexes with solved structures.
(A) The Mediator complex (PDB 5U0P) is a modular complex composed of functionally distinct sub-assemblies (Head, Middle and Tail modules).
(B) Fitness profiles from the CRISPR-Cas9 dataset of representative subunits of the Mediator complex Head, Middle and Tail modules, colored as in (A). Both rows (genes) and columns (cell lines) are hierarchically clustered.
(C) CRISPR-Cas9 fitness correlation network for Mediator complex, with subunits colored by module membership, and edges between nodes thresholded either at rank one (left) or rank four (right).
(D) The 26S proteasome is composed of the 20S core and 19S regulatory particles, shown here as modules in a structural interaction network, in which each node represents a subunit and each edge represents a physical interaction (buried surface area, Å^2) between subunits in the solved structure (PDB 5GJR).
(E) Fitness correlation networks in the RNAi dataset at different fitness rank thresholds reflect the sub-complex structural organization of the proteasome. Sequentially including edges across rank levels reveals edges preferentially linking genes within the same sub-complex. Proteasome subunit names are abbreviated to their shortest identifying sequence (ex: PSMA1 -> A1).
(F) The RNA polymerase II complex (PDB 5FLM), represented as a structural interaction network. The protein complex is composed of four distinct subassemblies, in particular, two functionally obligate heterodimeric subunits: the assembly core (POLR2C-J) and the detachable recognition stalk (POLR2D-G).
(G) The fitness correlation network for RNA Pol II in the RNAi dataset at different rank thresholds. The overlap between structural edges and functional edges present between protein complex subunits is statistically significant (Fisher’s Exact Test, p-value = 8.9e-3).

