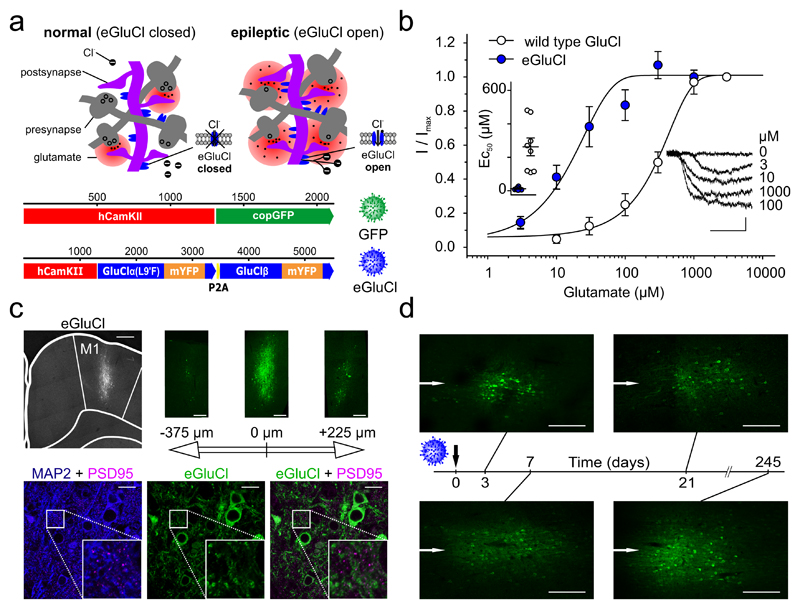
Figure 1. Mode of action and glutamate sensitivity of eGluCl.
(a)Top: proposed mode of action of eGluCl. eGluCl biochemically senses increased glutamate concentrations during impending seizures, and subsequently silences neurons by opening an inhibitory Cl- conductance. Bottom: lentiviral transfer plasmid design. (b) Electrophysiological characterization of glutamate sensitivity of wild type GluCl and eGluCl in Neuro-2a cells. Left inset: estimated EC50 in individual experiments (wild type: 262±53μM, n=8 cells; eGluCl: 12±3μM n=8 cells; mean±sem, p<0.001, Student’s t-test). Right inset: glutamate-evoked currents from a representative experiment (scale bar 0.5sec and 0.1nA). (c) Immunolabeling of eGluCl after injection in primary motor cortex (M1) indicates a spread of around 700 μm (left image, M1 region is indicated, scale bar 500μm). The three images on the right show slices from the same brain at position -375, 0, and +225μm anterior and posterior to the eGluCl injection site respectively (scale bar 250μm). The bottom three images show MAP2 + PSD95 (left) to map the cell shape and synapse location, eGluCl (middle), and eGluCl + PSD95 to map eGluCl expression at the synapse (right) (scale bar 20μm). Approximately 0.29±0.01% of eGluCl occurred at PSD95 puncta, and conversely 13.50±2.49% of PSD95 co-localized with eGluCl in transduced areas of the brain (Pearson’s correlation coefficient: 0.19±0.03, n=3 animals). (d) Expression pattern of eGluCl at different time points (3, 7, 21, and 245 days) post–Rx (scale bar 250μm) (representative images from n=2 animals). The white arrows indicate the injection needle track.
note

