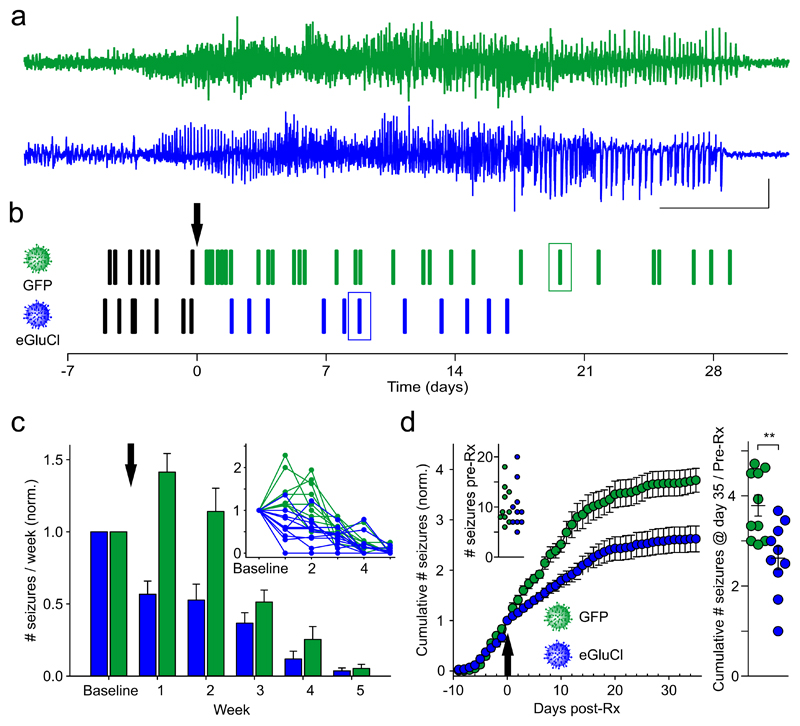
Figure 3. eGluCl reduces the absolute number of seizures in a model of chronic focal neocortical epilepsy.
(a) Representative seizures from two animals injected with tetanus toxin into layer 5 of the visual cortex after treatment with eGluCl or control GFP lentivector. (scale bar 10sec and 0.5mV). (b) Raster plot of seizures in the same animals. Boxes: seizures in panel (a). TetTx was injected at surgery (day -11), and the arrow indicates the timepoint of either eGluCl or GFP lentivector injection (day 0). (c) Seizure frequency (per week, mean±sem) for animals treated with either eGluCl (n=10 animals) or control GFP lentivector (n=10 animals) (indicated by the arrow), normalized by pre-Rx seizure rates (generalized log-linear mixed model: F(1, 59)=20.66, treatment effect p<0.001; F(8, 59)=17.28, treatment*week interaction effect p<0.001). The inset shows all individual experiments. (d) Normalized cumulative seizure frequency (per day) for animals injected with either eGluCl or control GFP lentivector (mean±sem). Inset: absolute number of seizures pre-Rx for the two groups (eGluCl 10.1±1.5, n=10; GFP 10.4±1.2, n=10; mean±sem, p=0.761, Student’s t-test). The arrow indicates the timepoint of eGluCl or GFP injection. Right panel: total number of seizures post-Rx, normalized by pre-Rx rate, for animals injected with either eGluCl or GFP control (eGluCl: 2.62±0.26, n=10; GFP: 3.79±0.24, n=10; mean±sem, p=0.004, Student’s t-test). **p<0.01.

