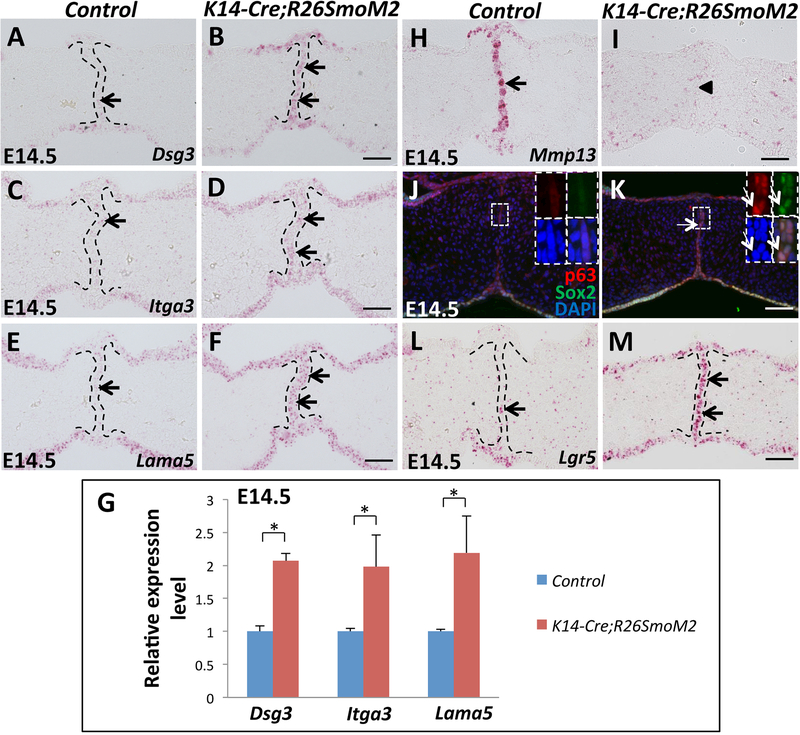
Figure 5. Constitutive activation of Hh signaling in palatal epithelium upregulates cell adhesion-associated genes and epithelial progenitor cell-associated genes in the MEE.
(A-F) RNAscope in situ hybridization of Dsg3, Itga3 and Lama5 (red dots, indicated by arrows) in frontal sections of E14.5 control and K14-Cre;R26SmoM2 palatal shelves. (G) qPCR analysis of Dsg3, Itga3 and Lama5 in E14.5 control and K14-Cre;R26SmoM2 palatal shelves. Values are expressed relative to control. *, p<0.05. (H-I) RNAscope in situ hybridization analysis of Mmp13 (red dots, indicated by arrow) in frontal sections of E14.5 control and K14-Cre;R26SmoM2 palatal shelves. Arrowhead indicates absence of Mmp13 expression. (J-K) Immunofluorescence of ΔNp63 (p63, red) and Sox2 (green) in frontal sections of E14.5 control and K14-Cre;R26SmoM2 palatal shelves. Boxed areas in (J) and (K) are shown magnified in the top right corners with red (p63), green (Sox2), blue (DAPI) and merged channels. Arrows indicate co-expression of ΔNp63 and Sox2. (L-M) RNAscope in situ hybridization analysis of Lgr5 (red dots, indicated by arrows) in frontal sections of E14.5 control and K14-Cre;R26SmoM2 palatal shelves. Black dotted lines indicate the location of the MEE. Scale bars: 50 μm.

