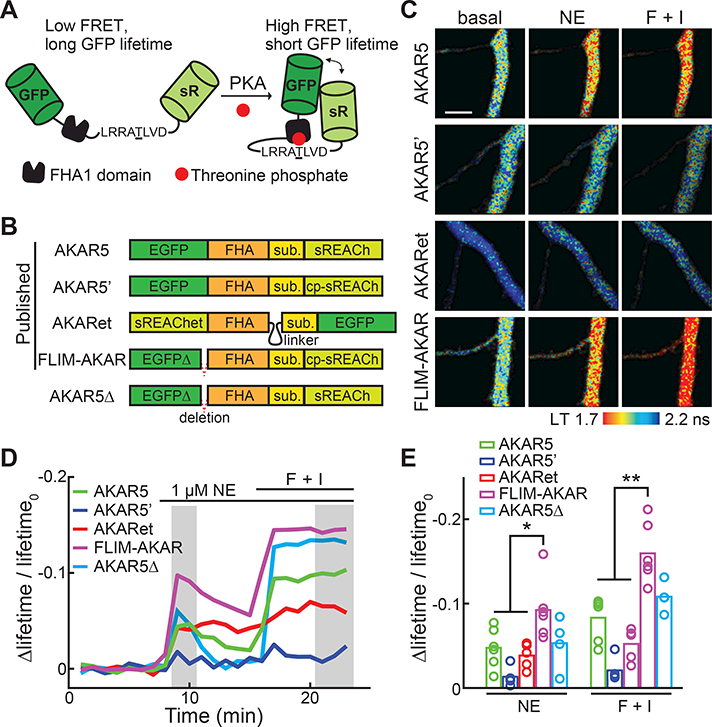
Figure 1. Schematics and comparisons of available AKARs.

(A) Schematic of the general design of AKARs. sR: sREACh. FHA1: the forkhead associated domain 1 of the Rad53p protein. This panel is a modification from the original schematic published in (Zhang et al., 2001).
(B) Schematics of available 2pFLIM AKAR sensors illustrating their domain structures and differences. Sub: PKA substrate sequence.
(C) Representative lifetime images of current 2pFLIM AKAR sensors in the apical dendrites of CA1 neurons at rest, after stimulation with 1 μM norepinephrine (NE), followed by 25 μM forskolin/50 μM IBMX (F+I). All images are pseudo-colored according to the same lifetime scale to show the differences in baseline and response amplitudes across sensors.
(D, E) Representative timecourse traces (D) and amplitudes (E) of Δlifetime/lifetime0 of the indicated AKAR sensors. n = 6 neurons for AKAR5 and FLIM-AKAR; 5 for AKAR5’ and AKARet; and 4 for AKAR5Δ.
Error bars are s.e.m.
See also Figure S1 and S2.
