
Figure 2. Microtubule-targeting enhances the performance of AKAR sensors.
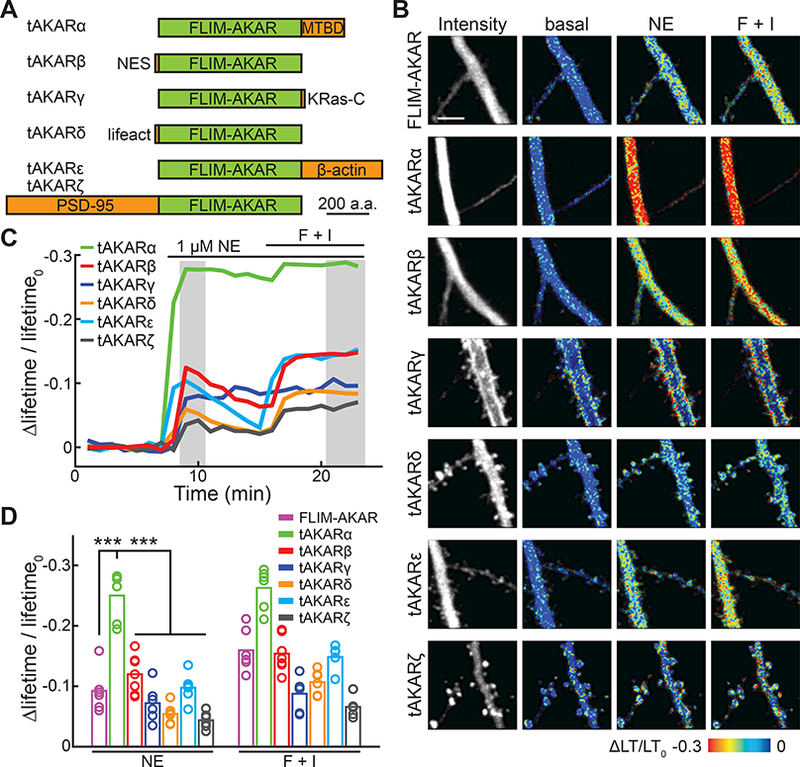
(A) Schematic of tAKAR variants.
(B) Representative basal fluorescence intensity and Δlifetime/lifetime0 images in the apical dendrite of CA1 neurons with the indicated simulations. LT: lifetime.
(C, D) Representative timecourse traces (C) and amplitudes (D) of Δlifetime/lifetime0 of tAKARs. n = 6 – 7 neurons for all sensors.
Error bars are s.e.m.
See also Figure S3.