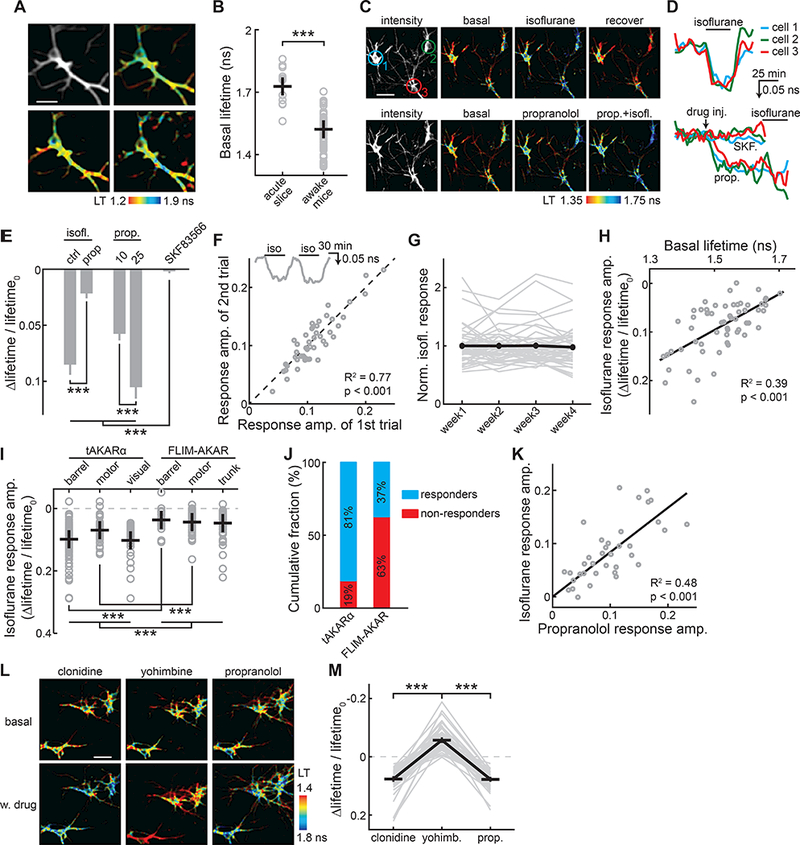
Figure 6. In vivo imaging of tAKARα reveals basal tonic activity in cortical neurons of awake mice.

(A) Representative intensity and lifetime (LT) images of a neuron imaged over 35 days. The postnatal ages at the time of imaging are labeled.
(B) Comparison of basal tAKARα lifetimes between the apical dendrites of L23 neurons in acute brain slices and the neurons imaged in awake mice. n (neurons/mice) = 11/5 for acute slices, and 59/8 for awake mice.
(C, D) Representative lifetime images (C) and timecourse traces (D) of three example neurons in one field of view responding to the indicated drug administration.
(E) Collective results of PKA activity in the presence of the indicated pharmacological manipulation. Dosages are: 1.25% isoflurane with or without pretreatment with 25 mg/kg propranolol, 10 or 25 mg/kg propranolol, or 0.2 mg/kg SKF83566. n = 48 neurons from 5 mice.
(F) Isoflurane-induced responses of individual neurons from two consecutive trials. Inset shows a representative trace for the experiment. The line of equity (not from fitting) is also shown. n = 47 neurons from 3 mice.
(G) Isoflurane-induced responses across four weeks normalized to the averaged response of the first week. Both individual cell traces (gray lines) and the averaged response (black) are shown. n = 46 neruons from 3 mice.
(H) A linear fit of the isoflurane-induced PKA responses in individual neurons correlated with the basal lifetime in the corresponding neuron. n = 59 neurons from 8 mice.
(I) Comparison of isoflurane-induced PKA responses visualized by tAKARα and FLIM-AKAR across different cortical regions. Trunk: the trunk somatosensory cortex. n (neurons/mice, from left to right) = 91/5, 43/4, 31/2, 18/2, 49/2, and 43/4.
(J) Fraction of neurons imaged across brain areas that exhibited detectible responses to isoflurane using the indicated sensors. The threshold is 1. 5 times the standard deviation of the baseline reponses. N (neurons/mice) = 165/11 for tAKARα, and 110/8 for FLIM-AKAR.
(K) A linear fit of the isoflurane responses in individual neurons correlated with propranolol response in the same neurons. n = 48 neurons from 5 mice.
(L) Representative lifetime images of three example neurons in one field of view responding to the indicated pharmacological manipulations.
(M) Summary results of PKA responses in the presence of the indicated pharmarcological manipulations. Dosages are: 1 mg/kg clonidine, 5 mg/kg yohimbine, and 25 mg/kg propranolol. n = 63 neurons from 6 mice.
LT: lifetime; prop.: propranolol; isofl.: isoflurane; SKF.: SKF83566; yohimb.: yohimbine.
Error bars are s.e.m.
