
Figure 4.
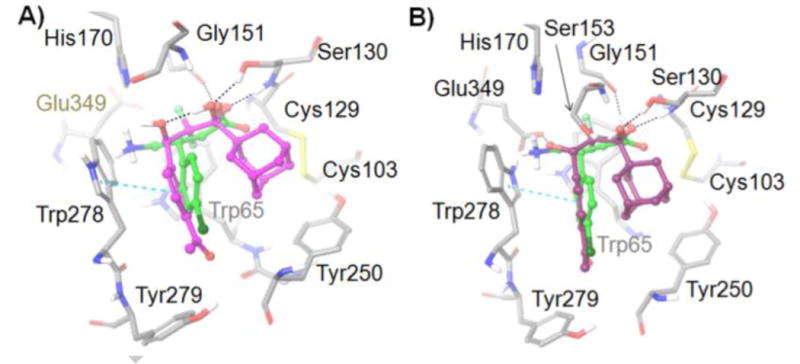
Active site residues (gray) of the GABAB receptor from docking studies with: A) (R)-3 (GlideScore = −10.080) (magenta) and B) (S)-3 (GlideScore = −9.606) (purple). (R)-Baclofen (GlideScore = −11.063) is also shown in each image (green). Amino acids are depicted as tubes and ligands are represented as ball-and-stick. H-bonds and aromatic π–π stacking are shown as black and cyan dashed lines, respectively.