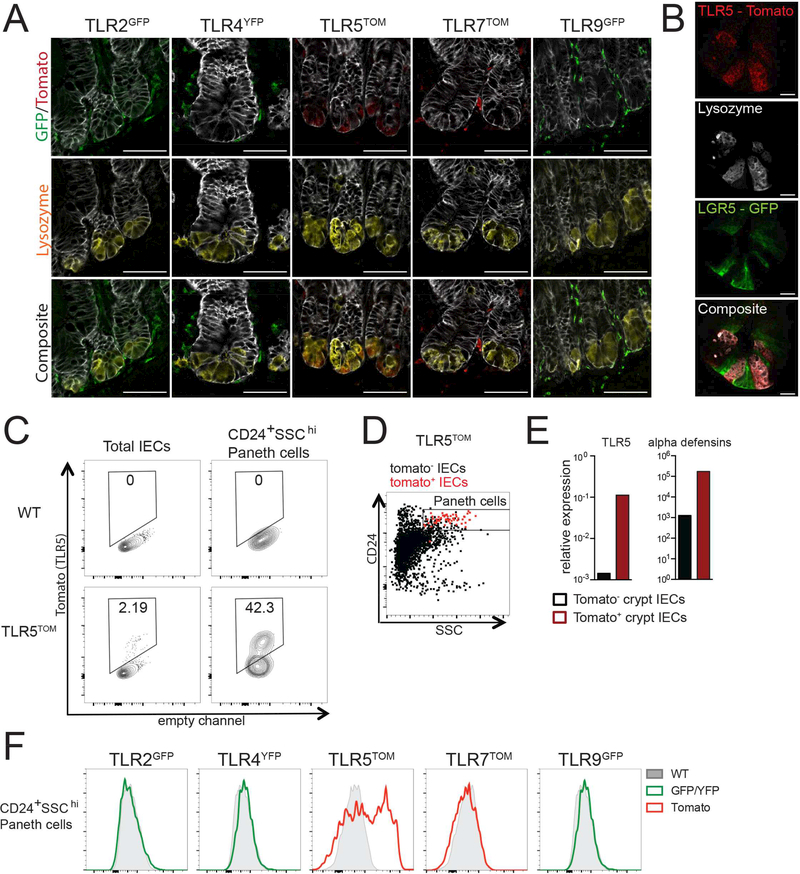
Figure 2: TLR5 expression is restricted to Paneth cells in the SI epithelium.
(A) SI sections from reporter mice stained for lysozyme (Paneth cells) and antibodies to either GFP/YFP or tomato (TLR reporters). Images were taken at 63× magnification and exposures were set using staining of WT mouse SI. Images are representative of at least 2 independent experiments, each including 2–5 mice of each genotype. Scale bars are 50 microns.
(B) SI sections from TLR5TOM x LGR5-GFP mice were stained for tomato (TLR5), GFP (LGR5), and lysozyme (Paneth cells). Images were taken at 63× magnification and exposures were set using staining of WT mouse SI. Images are representative of 2 independent experiments, each including 2–5 mice. Scale bars are 10 microns.
(C) Tomato fluorescence from total IECs (live, CD45-Epcam+) or Paneth cells (live, CD45-Epcam+CD24+SSChi) isolated from crypt preparations from the SI of WT or TLR5TOM mice.
(D) Flow cytometry plot of total IECs from crypt preparations from TLR5TOM mice pregated on tomato expression. Tomato+ cells are shown in red and tomato-cells are shown in black. For C-D, flow cytometry plots are representative of 3 independent experiments, each including 2–5 mice.
(E) Tomato+ and tomato- IECs were sorted from SI crypt preparations from TLR5TOM mice and gene expression was assessed by quantitative RT-PCR. Due to low cell numbers, cells from three separate sorting experiments, including IECs from over twenty mice, were pooled to generate results. Results are shown as expression relative to beta actin.
(F) Paneth cells (CD24+SSChi) were gated from SI crypt preparations from indicated mice and reporter fluorescence was assessed using flow cytometry. Plots are representative of at least 3 independent experiments, each including 2–5 mice of each genotype.

