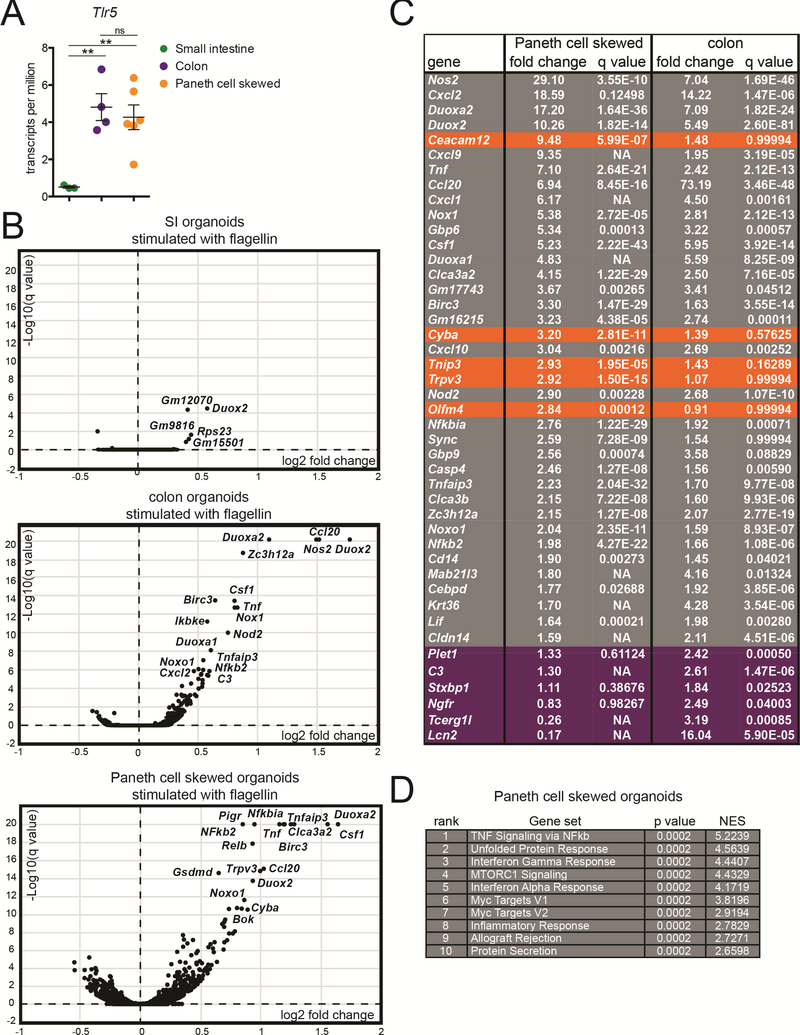
Figure 5: TLR5 signaling initiates a common gene program in colon IECs and Paneth cells.
(A) Expression of TLR5 in Paneth cell skewed and colon organoids assessed using RNA-sequencing. Values are transcripts per million. Significance was determined using one-way ANOVA ** p ≤ .01.
(B) Volcano plots showing the results of RNA-sequencing on SI organoids, colon organoids, and Paneth cell skewed organoids. Genes are plotted by the average fold change vs. significance of their induction after stimulation with flagellin for 4 hours. Log10(q values) were capped at 20 for this analysis. Selected significantly induced genes are labeled.
(C) The top 30 most highly induced genes from flagellin-stimulated Paneth cell skewed organoids and colon organoids, listed from highest to lowest fold change in Paneth cell skewed organoids. Genes were pre-filtered on significance, with q values of <0.05. Genes from the top 30 most induced genes in stimulated Paneth cells that are induced less than 1.5-fold in colon organoids are highlighted in orange, and genes from the top 30 most induced genes in colon organoid that are induced less than 1.5 fold in Paneth cell skewed organoids are highlighted in purple. p-values listed as NA were not calculated because the counts for indicated genes included at least one outlier that did not fall within the normal distribution.
(D) Top 10 gene sets enriched in Paneth cell skewed organoids stimulated with flagellin using gene set enrichment analysis. For A-D, RNA-sequencing was performed on RNA from unstimulated and flagellin-stimulated SI organoids isolated from 3 independent experiments, colon organoids isolated from 4 independent experiments, and Paneth cell skewed organoids isolated from 6 independent experiments.

