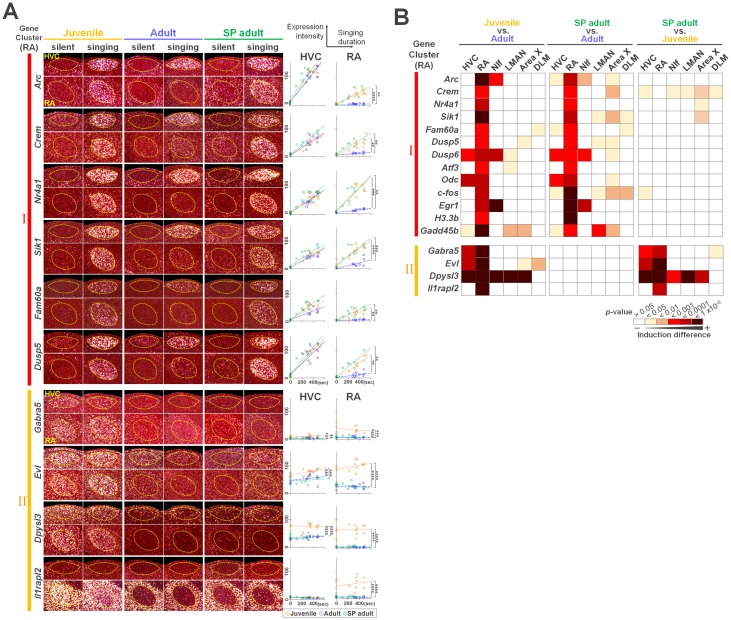
Fig 4. Cumulative singing experience–regulated gene expression in RA projection neurons between silent and singing condition.
(A) RA Cluster I (Arc, Crem, Nr4a1, Sik1, Dusp5, and Fam60a) and II (Gabra5, Evl, Dpysl3, and Il1rapl2) gene expression in HVC and RA in juvenile, adult, and SP adult (1–2 days after release) birds. Right panels: induction intensity of the singing activity–dependent genes in juvenile (orange), adult (blue), and SP adult (green) birds in HVC and RA. The last 30 minutes of the singing duration of each bird is shown at the bottom. Lines represent linear approximation curve (*p < 0.01, **p < 0.001, ***p < 0.0001, ****p < 0.00001; ANCOVA with Bonferroni correction). (B) Heat maps showing induction differences of Cluster I and II genes in song nuclei between adult, juvenile, and SP adult (1–2 days after release) birds (ANCOVA with Bonferroni correction). Supporting data can be found in S4 Data. ANCOVA, analysis of covariance; DLM, dorsal lateral nucleus of the medial thalamus; LMAN, lateral magnocellular nucleus; NIf, interfacial nucleus of the nidopallium; RA, robust nucleus of the arcopallium; SP, singing-prevented.

