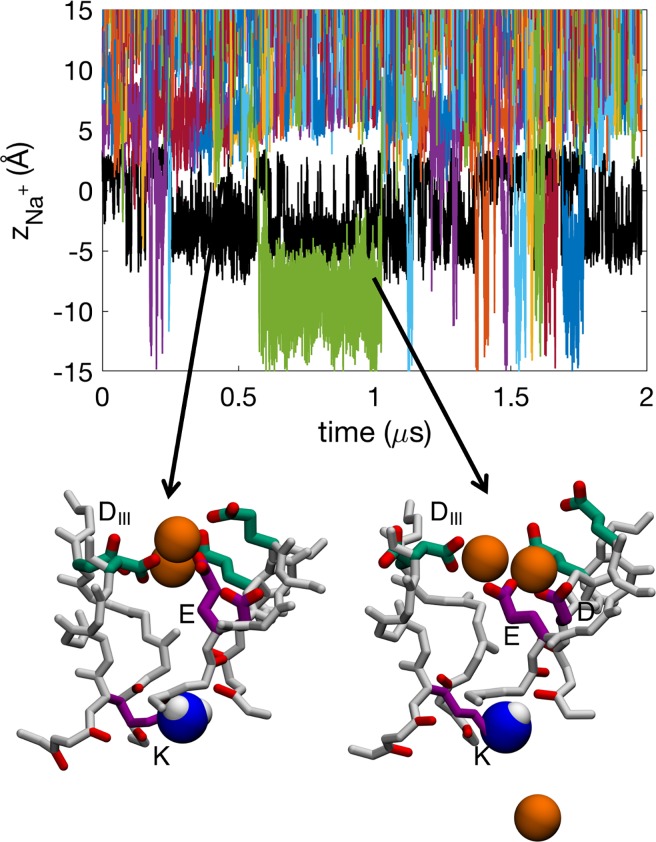
Fig 2. Time series showing the z positions of deprotonated Lys0 (K; black) and Na+ ions (colors) in the Nav1.2 SF.
Insets show snapshots of Na+ ions (orange balls) in representative configurations with active residues from the DEKA (purple) and EEDD (green) rings labeled. The neutral amine group of the Lys shown is shown as blue and white balls. See also sample trajectory in S1 Movie.

