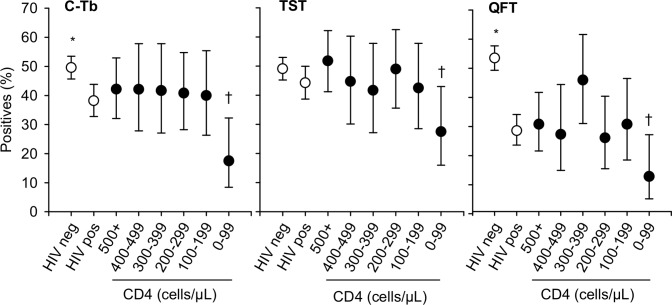
Fig 2. Test positivity rate according to HIV status and CD4 count.
The data shown excludes participants with unknown HIV status and healthy control group. Error bars indicate 95% CI. Cut-point for TST was 5 mm in HIV-infected and 15 mm in others. C-Tb: N = 921 (625 HIV-uninfected, 296 HIV-infected). TST: N = 923 (627 HIV-uninfected, 296 HIV-infected). QFT: N = 818 (126 indeterminate, 538 HIV-uninfected, 280 HIV-infected). Data specific to the active and non-TB groups are shown in S2–S4 Tables. *HIV-uninfected versus HIV-infected p<0.05. †CD4 counts ≥100 cells/μL versus counts <100 cells/μL in HIV-infected; p<0.05.

