
Figure 2.
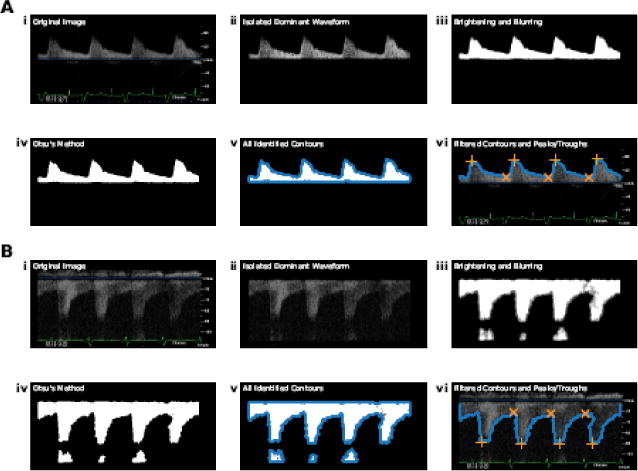
Processing steps of the automated algorithm shown for: (A) a higher-quality image and (B) a lower-quality image. (i) Original image; (ii) isolated dominant waveform; (iii) image following brightening and iterative blurring; (iv) image following Otsu’s method; (v) all identified contours (blue points); (vi) filtered contours (blue points) and identified peaks (orange crosses) and troughs (orange X’s). Notably, both positive and negative waveforms are shown to reinforce the automated nature of the algorithm in identifying the location of the dominant waveform structure in relation to the zero velocity baseline.