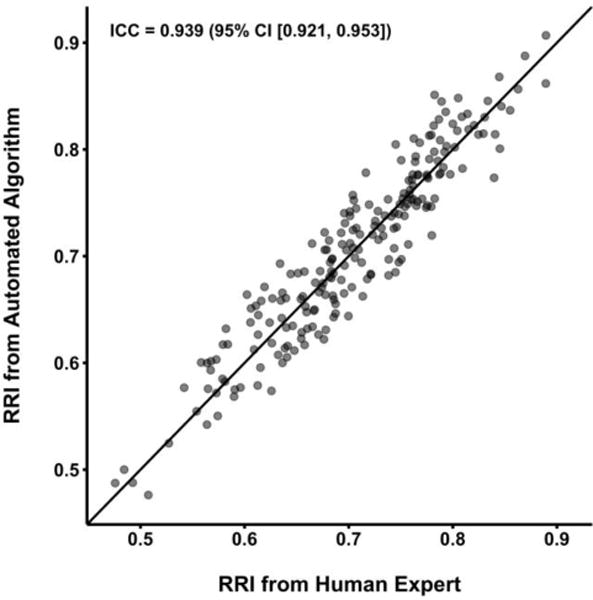
Figure 4.

Scatter plot displaying renal resistive index (RRI) values rated by human experts compared to those rated by the automated algorithm in the validation cohort using the parameters selected through parameter tuning on the development cohort. The black line represents the identity line (complete agreement). Intraclass correlation coefficient (ICC) is displayed with a 95% confidence interval.
