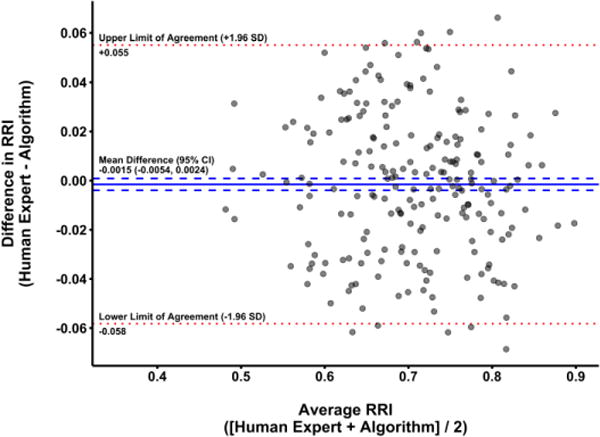
Figure 5.

Bland-Altman plot displaying agreement between renal resistive index (RRI) values rated by blinded human experts and the automated algorithm in the validation cohort using parameters selected in the parameter tuning process on the development cohort. For each image, mean RRI (average of human and algorithm values) is plotted against the difference in RRI (human value – algorithm value). The mean difference between human experts and the algorithm is represented by the solid blue line, with 95% confidence intervals (CI) for the mean difference shown as dashed blue lines. The upper and lower limits of agreement (mean difference ± 1.96 standard deviation (SD) units) are shown as dotted red lines. Notably, the 95% CI for the mean difference contains 0, indicating a lack of systematic bias in the algorithm when compared to human experts.
