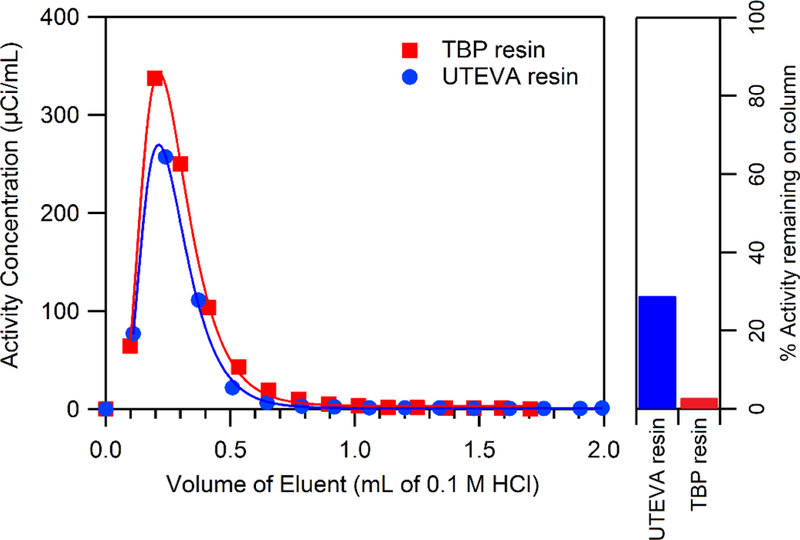
Figure 3.

Elution profiles of 89Zr from 100 mg of TBP and UTEVA resin in 0.1 M HCl. The right bar-plot shows residual activity on each column, with the UTEVA column containing significantly more activity. This residual activity did not appear to behave chromatographically with further elution attempts with 0.1 M HCl, but the activity was readily removed from the column with 3 M HCl. Trend lines are eye-guides only.
