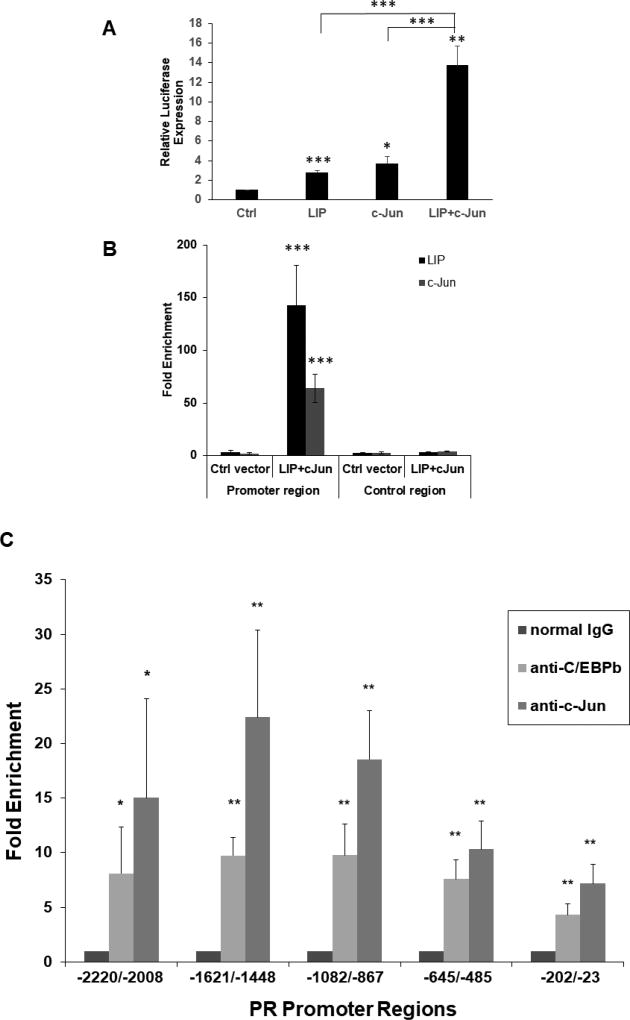
Fig. 3.
Plasmid immunoprecipitation (PIP) and chromatin immunoprecipitation (ChIP), respectively, show binding of C/EBPβ and c-Jun to the promoter regions of the −117/+63 PR promoter-reporter and the endogenous PR gene, consistent with their transactivation of the PR promoter. (A) Transient co-transfections of LIP and c-Jun expression vectors were carried out in MC7-L1 with the −117/+63 PR promoter-reporter. 50 ng LIP and 50 ng c-Jun expression vectors were transfected per 5×10⁴ cells. Luminometer values were normalized for expression from a co-transfected SV40 early enhancer/promoter-Renilla luciferase reporter. These values were then normalized to a relative value of 1.0 for cells receiving only “empty” pcDNA3.1 and neither C/EBPβ nor c-Jun expression vector. The data presented are the means of at least three experiments with SEM. p was calculated by Student’s t-Test in comparison to the control transfection. *, p < 0.1; **, p < 0.05; ***, p < 0.01. (B) Occupancy of C/EBPβ-LIP and c-Jun on wildtype −117/+63 PR promoter in PIP assays. MC7-L1 cells were transfected with the −117/+63 PR promoter-reporter that had been linearized by ScaI digestion and expression vectors for both C/EBPβ-LIP and c-Jun, or control expression vector (as indicated). Plasmid-protein complexes were precipitated with either C/EBPβ antibody or c-Jun antibody, or normal IgG. The DNA from precipitated plasmid was quantitated by qPCR, either with a primer pair for the promoter region (left panel) or with another primer pair for the control region (right panel). The value of qPCR-amplified product is calculated as the percentage of input, and then the fold enrichment is presented as the ratio of amplified product with specific antibody to that with nonspecific IgG antibody. Results are the mean of three independent experiments with SEM. p was calculated for each PIP with specific antibody by Student’s t-Test in comparison to the control vector transfection, and in comparison to the control region. ***, p<0.01. (C) Occupancy of the PR gene promoter region by C/EBPβ and c-Jun was determined by ChIP. Chromatin-protein complexes were precipitated with either C/EBPβ antibody or c-Jun antibody, or normal IgG. The DNA from precipitated chromatin was quantitated by qPCR with primer pairs for regions upstream of the predicted PRB transcriptional start site: −2220 to −2008 bp, −1621 to −1448 bp, −1082 to −867 bp, −645/−485 bp, and −202 to −23 bp. The value of qPCR-amplified product is calculated as the percentage of input, and then the fold enrichment is presented as the ratio of amplified product with specific antibody to that with nonspecific normal IgG antibody. Results are the mean of three independent experiments with SEM. p was calculated by Student’s t-Test in comparison to normal IgG. *, p<0.1; **, p<0.05.

