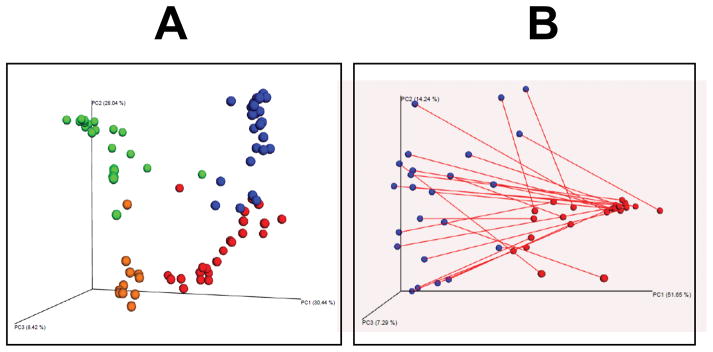
Figure 2.
Principal coordinates of transplanted (n = 24), GF (n = 23), and SPF (n = 11) mice, as well as human donors (n = 24.) 2A shows all four groups (human donors = red, GF mice = green, transplanted mice = blue, SPF mice = orange.) 2B only shows the humans (red) and recipient mice (blue), with each mouse-human dyad connected by a line.

