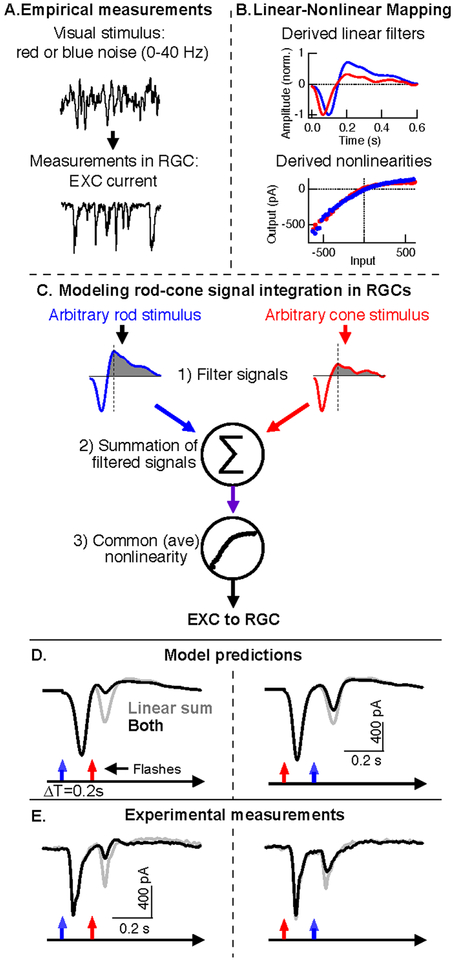
Figure 7:
Modeling the retinal integration and processing of rod and cone signals with a linear-nonlinear cascade model. A. Linear and nonlinear model components are derived from recordings of RGC responses to independent rod- and cone-preferring noise (0–40 Hz). B. Linear filters (top) and nonlinearities (bottom) derived from rod (blue)- and cone (red)-preferring noise stimuli. C. Model for predicting excitatory synaptic input to On parasol RGCs for arbitrary rod and cone stimuli. The final step of the model uses a common nonlinearity that reflects the average of the rod and cone derived nonlinearities. D. Model output in response to paired rod and cone flashes with a 0.2 s time offset. Gray lines are the linear sum of responses to separate rod and cone flashes, black lines are responses to the paired rod and cones flashes. E. Paired flash responses recorded from the same On parasol RGC used for noise experiments (A-D). Gray and black lines are the same as in D. Adapted from (Grimes et al., 2015).

