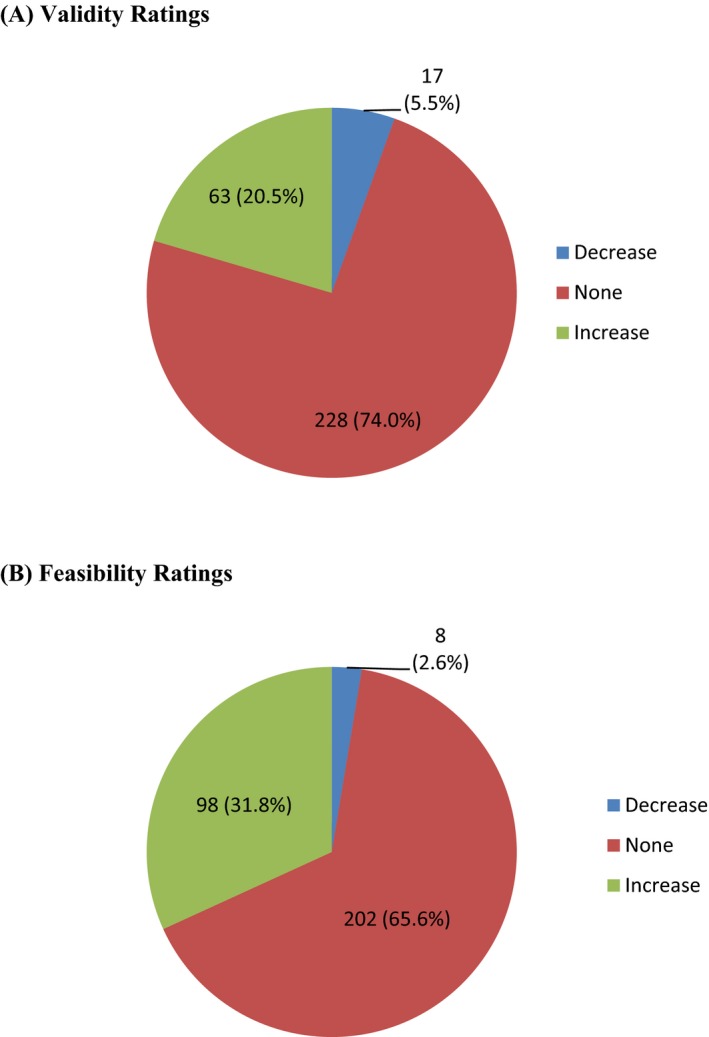
Figure 1.

- Notes. Ratings could increase, decrease, or remain unchanged between Round 1 and Round 2. (A) The majority of standards did not change in validity between Rounds 1 and 2 (n = 228, 74.0 percent). There were 63 (20.5 percent) standards with an increase in validity ratings and 17 standards (5.5 percent) with a decrease in validity ratings. (B) The majority of standards did not change in feasibility between Rounds 1 and 2 (n = 202, 65.6 percent). There were 98 (31.8 percent) standards with an increase in feasibility ratings and 8 (2.6 percent) standards with a decrease in feasibility ratings.
