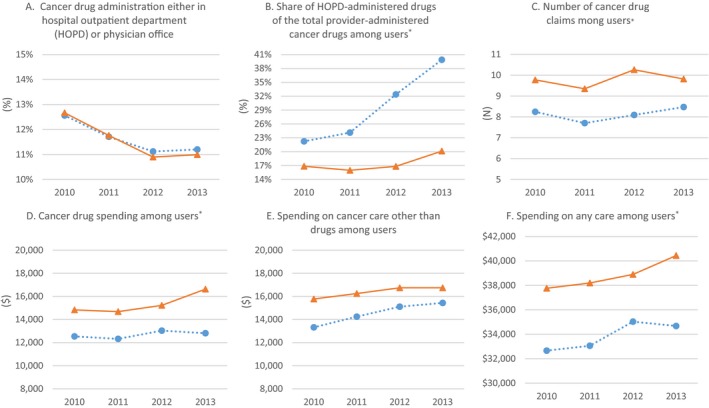
Figure 2.

- Notes: Data are from beneficiaries in markets (Hospital Referral Region) that had no 340B hospital before the study period; *Among patients who received any provider‐administered cancer drug;
 treatment group includes beneficiaries from markets that newly gained a 340B hospital during the study period;
  control group includes beneficiaries in markets with no 340B hospital.
