Figure 2.
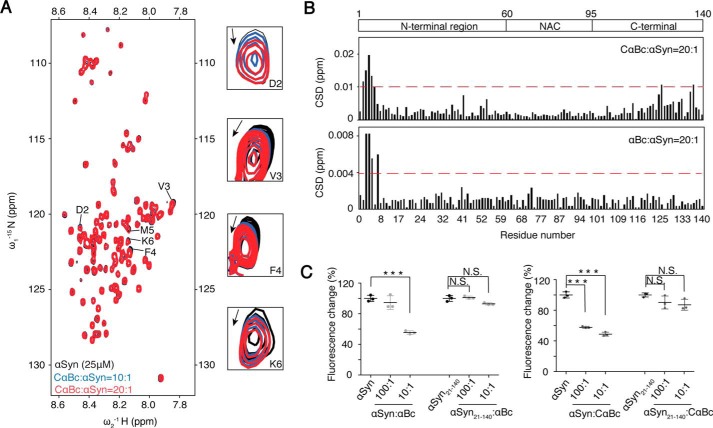
N terminus of αSyn binds to both CαBc and αBc. A, an overlay of the 2D 1H-15N HSQC spectra of 25 μm αSyn in the absence (black) and presence of CαBc at molar ratios (αSyn:CαBc) of 1:10 (blue) and 1:20 (red), respectively. Resonances with relatively large chemical shift perturbations are highlighted on the right. B, CSDs of 25 μm αSyn titrated by CαBc (top) and αBc (bottom), respectively. The CSD values were calculated using the empirical equation CSD = [ΔHN2 + 0.0289(ΔN)2]1/2 where ΔHN and ΔN represent the chemical shift differences of 1H and 15N, respectively. The domain organization of αSyn is shown on the top of the graph. NAC stands for non amyloid-β component. C, the inhibitory effects of αBc and CαBc on the aggregation of αSyn and αSyn(21–140), respectively. The ThT value was taken at the 60-h time point from the ThT kinetics curves. Error bars correspond to mean ± S.E. with n = 3. *** indicates p < 0.005, and N.S. indicates not significant.

