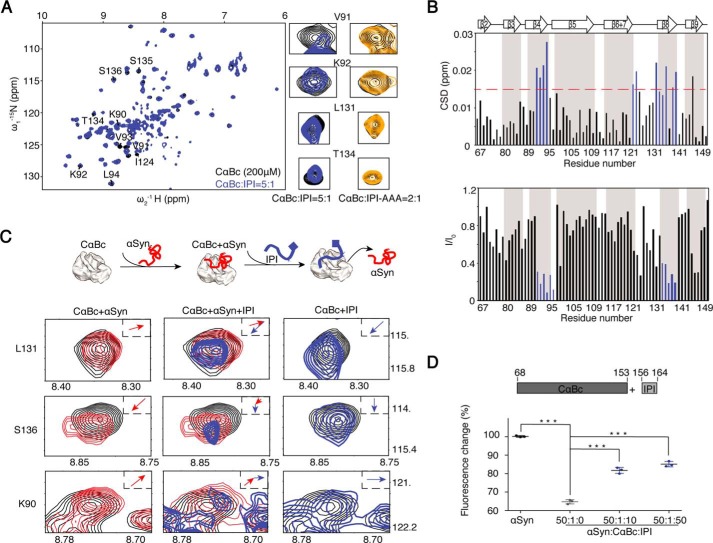
Figure 4.
Competitive binding of the CαBc β4/β8 surface by IPI peptide and αSyn. A, an overlay of the 2D 1H-15N HSQC spectra of 200 μm CαBc alone (black) and after incubation with 40 μm IPI peptide (blue). Resonances of four residues, Val91, Lys92, Leu131, and Thr134, that underwent significant changes are displayed in a zoomed-in view. The resonances of the same residues of CαBc (200 μm) in the presence of 100 μm IPI-AAA peptide (dark yellow) are shown on the right. B, residue-specific CSD (top) and intensity changes (I/I0; bottom) of CαBc in the presence of the IPI peptide. Residues with CSD >0.015 ppm and I/I0 <0.4 are highlighted in blue, respectively. C, resonance changes of Leu131, Ser136, and Lys90 of CαBc (black) in the presence of αSyn alone (left column; red), αSyn (middle column; red) followed by titration of the IPI peptide (middle column; blue), and the IPI peptide alone (right column; blue), respectively. The inset shows the direction of chemical shift changes upon titration. A cartoon of the sequential titrations of αSyn and the IPI peptide to CαBc is shown on top. D, addition of the IPI peptide weakens the chaperone activity of CαBc for inhibiting αSyn aggregation. The ThT value was taken at the 80-h time point from the ThT kinetics curves. Error bars correspond to mean ± S.E. with n = 3. *** indicates p < 0.005.

