Figure 2.
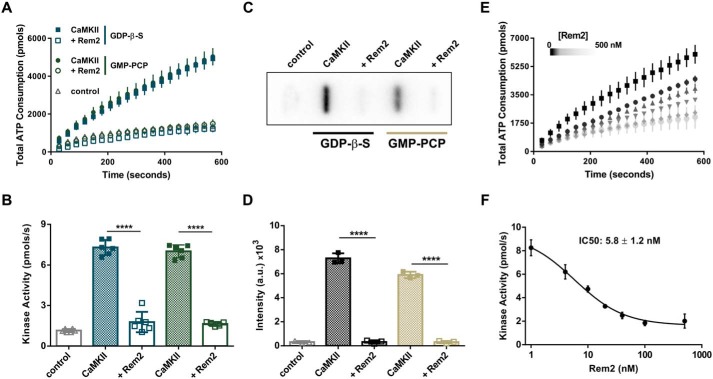
Rem2 is an inhibitor of CaMKIIα. A, ATP consumption by purified CaMKIIα (20 nm monomer) monitored using the PK/LDH assay with syntide-2 as a substrate (200 μm) with (open symbols) or without 500 nm Rem2 (filled symbols) in the presence of 40 μm GDP-β-S (blue squares) or 40 μm GMP-PCP (green circles). Samples devoid of CaMKIIα were used as negative controls (gray triangles). B, quantification (see “Experimental procedures”) of CaMKIIα kinase activity shown in A (n = 6; error bars indicate standard deviations; ****, p < 0.0001, two-way ANOVA with Tukey's post hoc test). In this panel and all subsequent figures, individual points in the scatter plot represent one experiment. C, representative image of a slot-blot of 32P-labeled syntide-2 exposed to a phosphorimaging plate. The phosphorylation of syntide-2 (200 μm) by CaMKIIα (20 nm) was conducted in the presence of radiolabeled ATP for 8 min in the presence (500 nm) or absence of Rem2 and either 40 μm GDP-β-S or 40 μm GMP-PCP as indicated. Samples without syntide-2 were used as controls. D, quantification of all syntide-2 experiments as in C (n = 3; standard deviations are shown; ****, p < 0.0001, two-way ANOVA with Tukey's post hoc test). E, concentration dependence of Rem2 inhibition of CaMKIIα kinase activity toward syntide-2. Black squares, 0 nm Rem2; black circles, 4 nm Rem2; upward triangles, 10 nm Rem2; downward triangles, 20 nm Rem2; gray diamonds, 40 nm Rem2; light gray circles, 100 nm Rem2. F, dose-response plot of the data shown in E. The average value of the slope of each curve was plotted as a function of Rem2 concentration (anti-log scale). The IC50 is 5.8 ± 1.2 nm and was obtained from the nonlinear fit of the points (see “Experimental procedures”).

