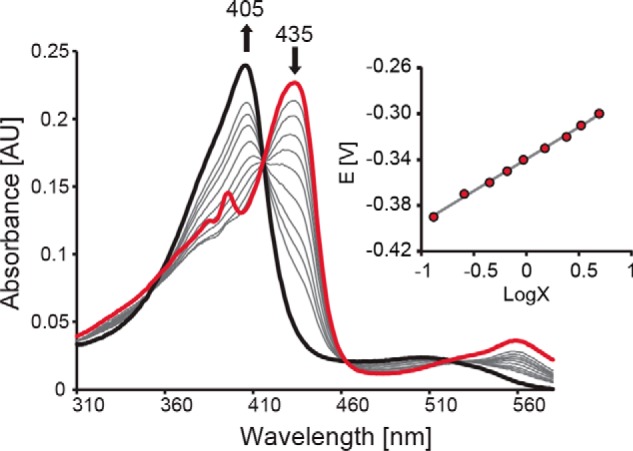
Figure 2.

Spectroelectrochemical titration of WT KpDyP. Shown are electronic absorption spectra of WT KpDyP at different applied potentials. The bold black spectrum represents fully oxidized, ferric enzyme (Soret maximum at 405 nm), and the red spectrum represents fully reduced (Soret maximum at 435 nm) protein. The inset shows the corresponding Nernst plot, where x represents (AλredMax − Aλred)/(AλoxMax − Aλox).
