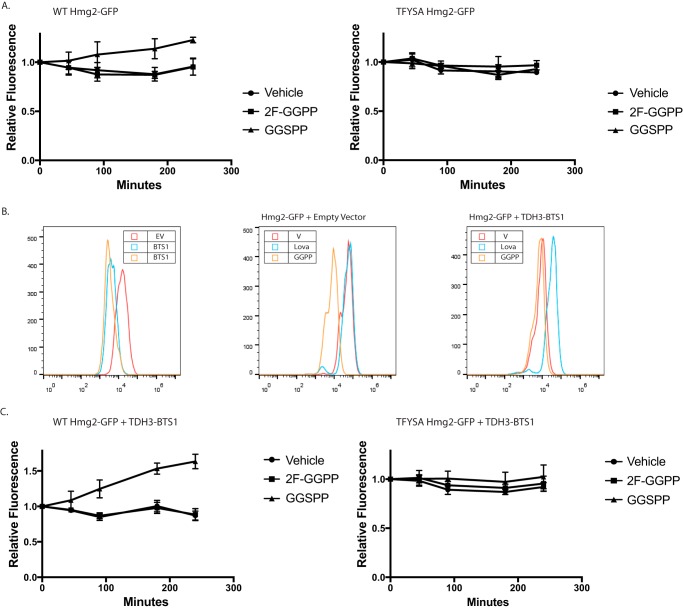
Figure 4.
In vivo antagonism of GGPP-stimulated Hmg2-GFP degradation. A, effect of 2F-GGPP (nonantagonist in vitro) or GGSPP (antagonist in vitro) on WT strain with normal production of GGPP due to the sterol pathway, expressing regulated Hmg2-GFP (left panel) or nonregulated TYFSA mutant of Hmg2-GFP (right panel). All graphs show mean fluorescence from three experiments by flow cytometry of 10,000 cells each, normalized to fluorescence at time 0. Error bars are S.E. B, strains with elevated GGPP production due to strongly expressed BTS1 gene encoding GGPP synthase. Left panel, steady-state fluorescence of strains expressing empty vector (EV; red) or integrated BTS1 expression plasmid (blue and orange), showing a strong shift in the steady-state level of Hmg2-GFP fluorescence due to elevated endogenous GGPP production. Middle panel, effect of lovastatin (Lova; blue) or GGPP (orange) on Hmg2-GFP fluorescence on empty vector strain. Right panel, same experiment with a BTS1-expressing plasmid present. Note that addition of GGPP has little further effect and that lovastatin, which blocks GGPP production due to elevated Bts1, causes strong stabilization. V, vehicle. C, effect of GGPP analogues on Hmg2-GFP steady-state levels in strains with elevated GGPP production. The experiment is the same as that in A but with strains strongly expressing BTS1 to increase GGPP and the Hmg2-GFP degradation rate. Left panel, the strain expresses normally regulated Hmg2-GFP; right panel, the strain expresses unregulated TYFSA mutant of Hmg2-GFP.

