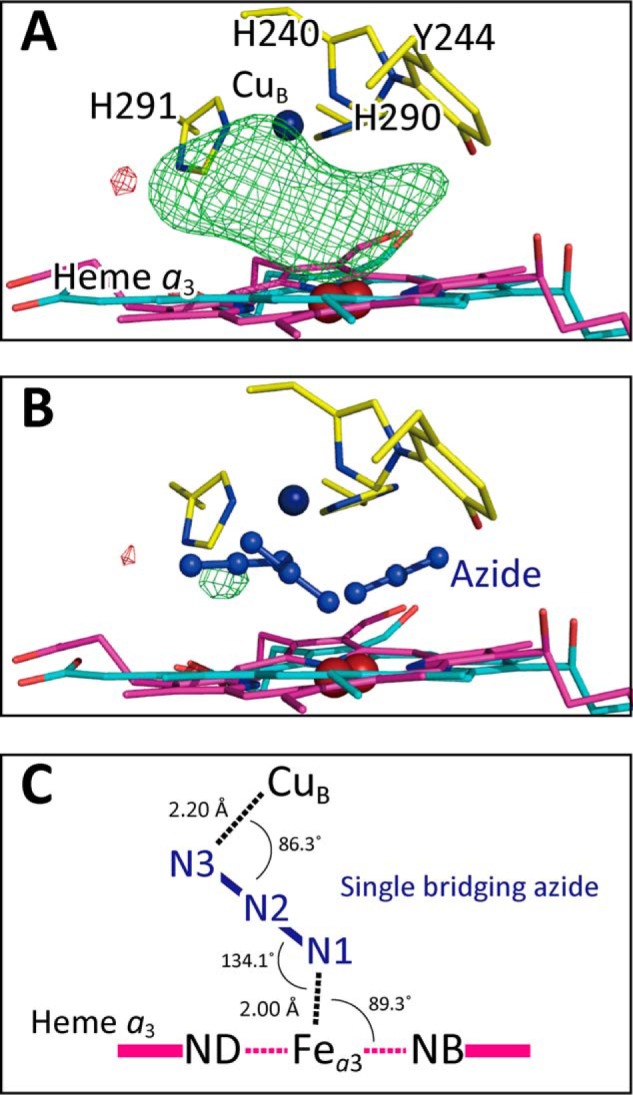
Figure 6.

Fo − Fc maps of the O2 reduction site of bovine heart resting oxidized CcO obtained from crystals exposed to 2 mm azide. A, Fo − Fc map without azide ion, showing the residual densities (green mesh) at +3.0 σ identical to the σ level of Fig. 2B, B, Fo − Fc maps with two terminally-bound azide ions at Fea3 and CuB, each at 30% occupancy, and a single bridged azide ion, giving essentially no residual density, C, schematic representation of the geometry of the single bridging azide.
