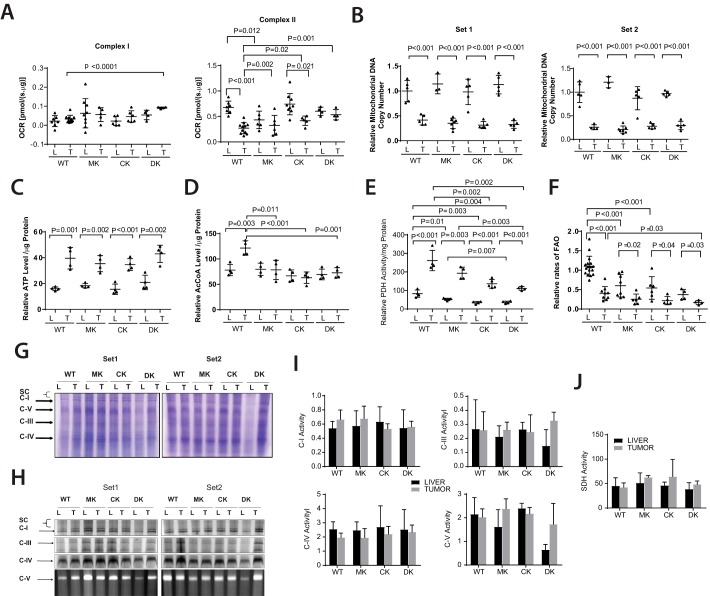
Figure 3.
Metabolic differences distinguish WT, Myc-KO, ChREBP-KO, and Double-KO livers and tumors. A, liver and tumor OCRs. The indicated tissues were dispersed, and their maximal OCRs were determined by respirometry following the addition of the TCA cycle substrates pyruvate, malate, and succinate. Complex I and Complex II responses were distinguished by measuring OCR before and after the addition of the Complex I inhibitor rotenone. B, reduction of mtDNA content in HBs is independent of tumor growth rates and the presence of Myc and/or ChREBP. Two different sets of TaqMan probes (Set 1 and Set 2) were used to independently amplify different regions of the mitochondrial genome. C, ATP levels in livers and tumors. D, AcCoA levels in livers and tumors. E, PDH activity in fresh livers and tumors. PDH was assessed by measuring the release of 14CO2 from 14C-labeled pyruvate (13, 51). F, FAO rates in fresh livers and tumors. FAO was assessed by measuring the release of water-soluble products from 3H-labeled palmitate-BSA (13, 51). G, representative Coomassie Blue–stained nondenaturing gels of ETC complexes from livers (L) and tumors (T) isolated from the indicated groups. The panel shows two sets of results. H, typical appearances of developed nondenaturing gels following in situ enzymatic assays for the ETC complexes I, III, IV, and V. I, quantification of ETC complex activities. Four sets of gels similar to those shown in H were scanned and normalized to the activity of Complex IV, which showed little variation among the different tissues (13, 25, 105). J, complex II activities were assayed in vitro on tissue lysates because the in situ assay is unreliable. All results were normalized to the mean activity of each complex measured in WT livers. Error bars, S.D.

