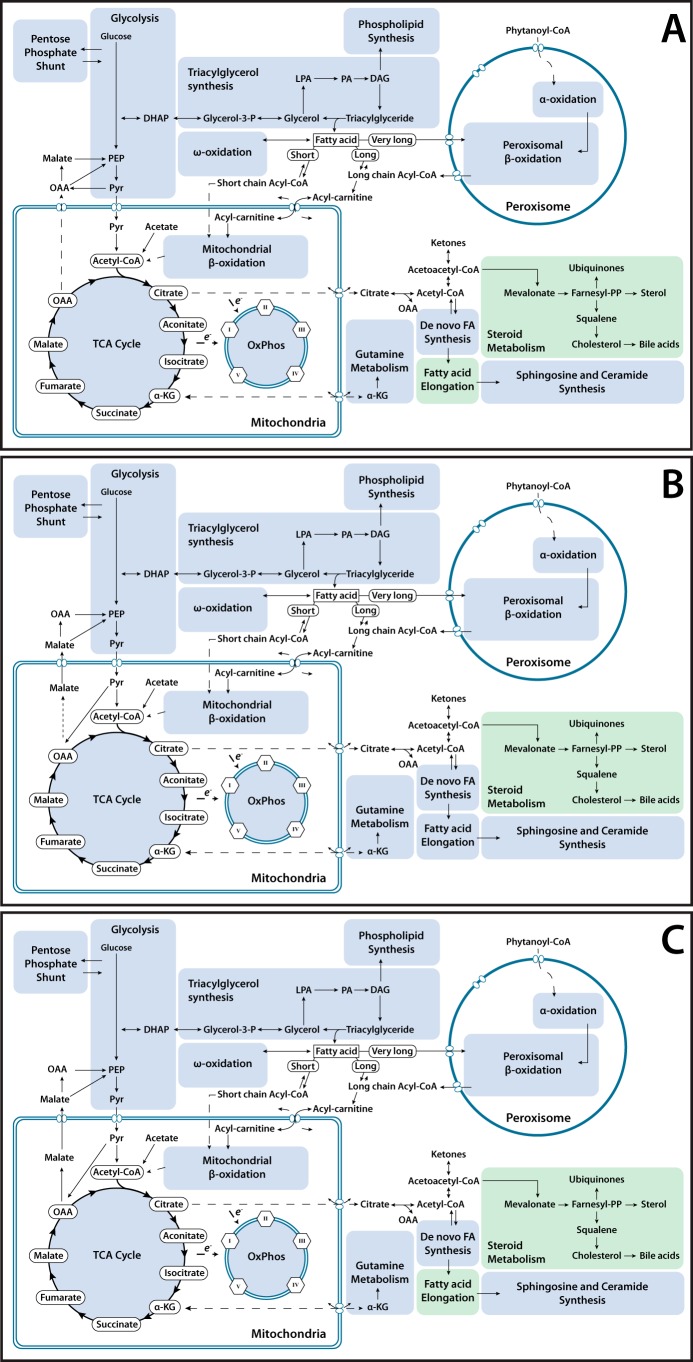
Figure 6.
Metabolic map of transcriptional changes in ChREBP-KO, Myc-KO, and Double-KO livers. Genes involved in direct metabolic processing of carbohydrates and lipids were mapped and grouped into general categories. Metabolic categories likely to be down-regulated relative to WT liver, either by significant down-regulation of genes encoding key rate-limiting enzymes or significant down-regulation of a large portion of many genes in the category, are colored green. Metabolic categories likely to be up-regulated in an experimental group relative to WT liver are colored red. A, summary of transcriptional changes in metabolic pathways in ChREBP-KO livers compared with WT livers, as described above. B, transcriptional changes in metabolic pathways in Myc-KO livers compared with WT livers. C, transcriptional changes in metabolic pathways in Double-KO livers compared with WT livers.

