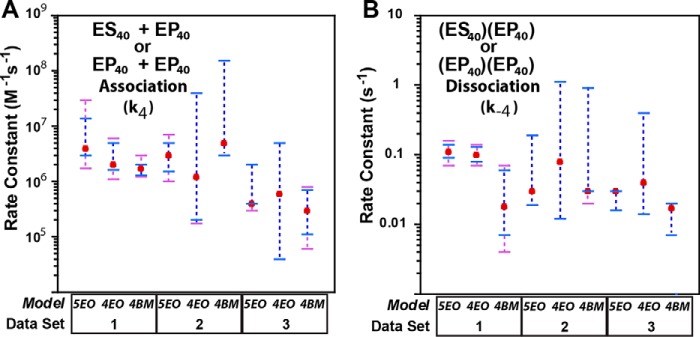
Figure 5.
Fitted rate constants for the fitting of each data set to each model. A, association rate constant for the association of two SgrAI–DNA complexes (i.e. k4). Best fit values are shown as red filled circles; error boundaries from FitSpace at 0.90 χ2 threshold (see “Experimental procedures”) are in purple dashed lines, and 0.95 χ2 thresholds are in blue (where only blue is visible indicates complete overlap). Data set and model descriptions are given in Tables 1 and 3, respectively. B, dissociation rate constant of one SgrAI–DNA complex from another (i.e. k−4). Colors are as in A.

