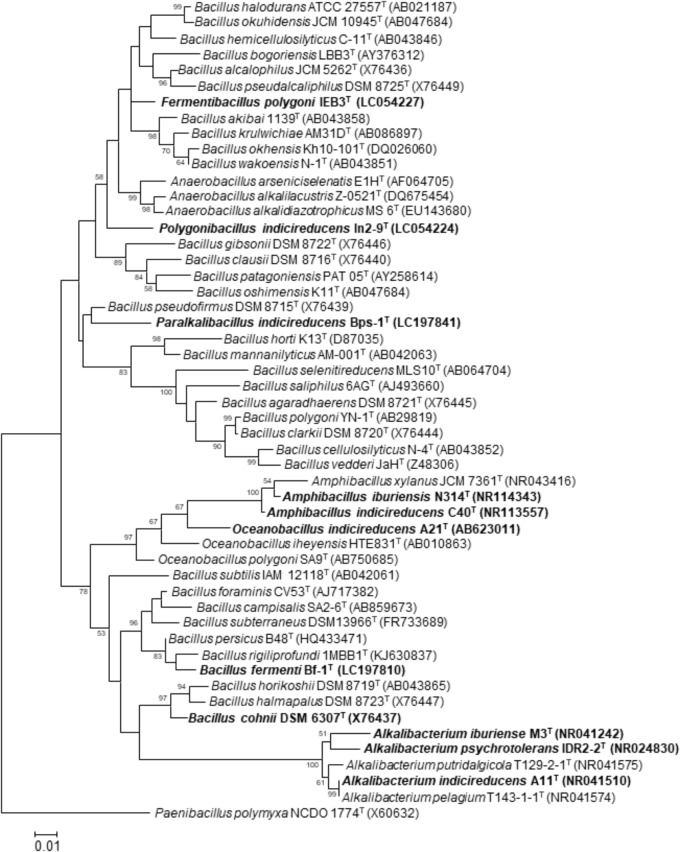
FIGURE 4.
Maximum-likelihood phylogenetic tree derived from 16S rRNA gene sequences, showing the phylogenetic positions of the isolated indigo-reducing bacteria. To construct the phylogenetic tree, the sequences were aligned with the sequences of neighboring species, and the consensus sequence was determined by CLUSTAL W (Thompson et al., 1994). The evolutionary history was inferred by using the maximum-likelihood method (Guindon and Gascuel, 2003) in MEGA 7 (Kumar et al., 2016). The evolutionary distance matrix was calculated by using Kimura’s two-parameter model (Kimura, 1980). Bold letters indicate the indigo-reducing bacteria. Although B. cohnii DSM 6307T was not one of our isolates, strains belonging to this species that reduced indigo were isolated from indigo fermentation fluid. Bootstrap percentages (based on 1000 replicates) >50% are shown at branch points. Scale bars = 0.01 substitutions per nucleotide position.

