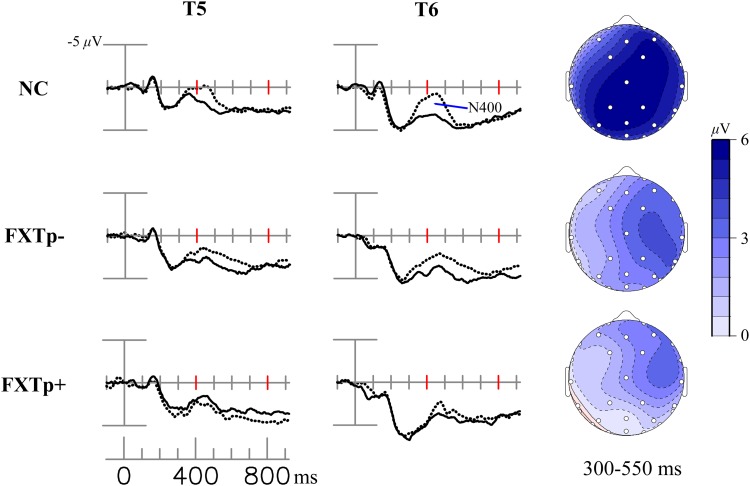
FIGURE 3.
The N400 congruity effect. Columns to the left: grand average ERPs to incongruous initial (dotted line) and congruous initial (solid line) presentations of incongruous – congruous new words at posterior temporal electrodes T5 and T6. Right column: topographical maps of the N400 congruity effect.

