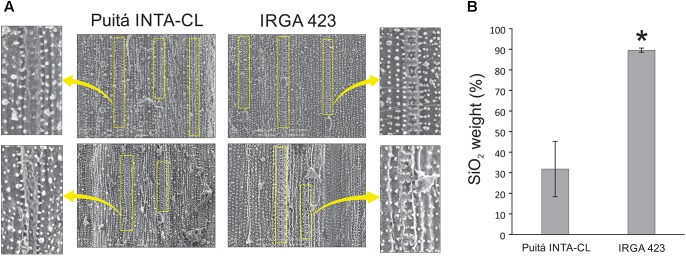
FIGURE 7.
Microscope observation of amorphous silica cells and SiO2 quantification. (A) SEM of the infested leaf surfaces (adaxial face) from susceptible Puitá INTA-CL and tolerant IRGA 423 cultivars, highlighting the amorphous silica cells. (B) Quantification of SiO2 using SEM. Figures in (A) are representatives of 10 analyzed leaf surfaces from each cultivar. Represented values in (B) are the averages of 10 samples ± SE. Mean values with one asterisk are significantly different as determined by the Student’s t-test (P ≤ 0.05). DW, dry weight.

