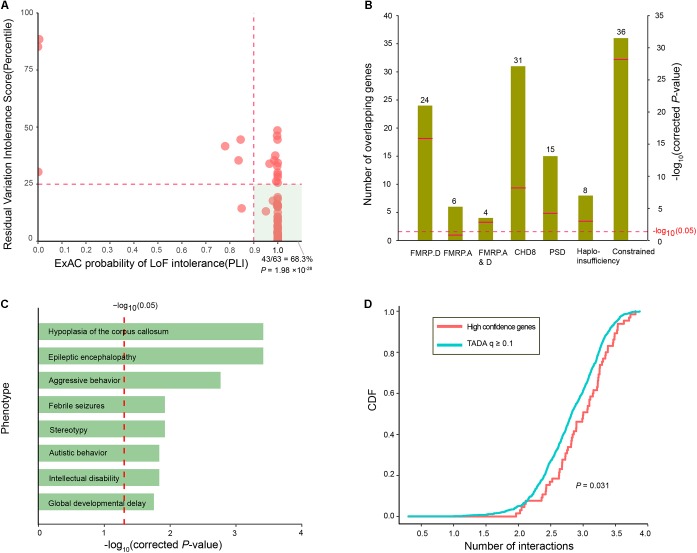
FIGURE 3.
Functional characteristics of the 63 high-confidence ID risk genes. (A) An illustration of the intolerance of the 63 ID risk genes with pLI scores (x-axis) and RVIS percentiles (y-axis). The hot region (green area) is defined by a pLI score > 0.9 and RVIS ≤ 25th percentile. The P-value was calculated using the Fisher’s exact test. (B) Enrichment analyses of the 63 risk genes in the FMRP targets from two independent data sets, CHD8 targets, PSD genes, haploinsufficient genes and constrained gene set. Green bars represent the number of overlapping genes. Red bars indicate corrected P-values, which were calculated with the Fisher’s exact test. (C) Enrichment of 63 ID genes in human phenotypes drawn from the Human Phenotype Ontology (HPO). The x-axis represents the log10 of the corrected P-values. (D) The cumulative distribution function (CDF) of the number of interactions (log10) is depicted for 63 high-confidence risk genes relative to q-values ≥ 0.1. A two-sample Kolmogorov–Smirnov test was used to detect the difference.

