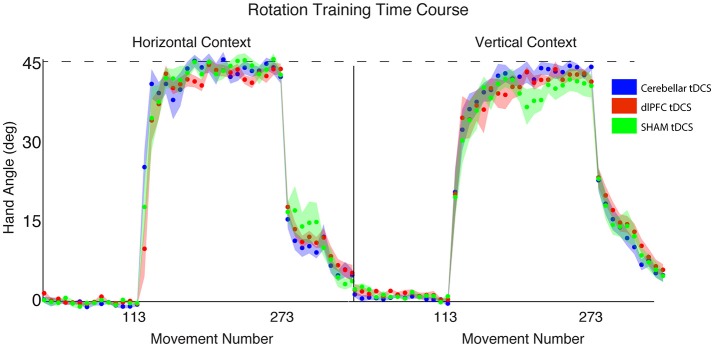
Figure 6.
Results from Experiment 3, examining the effects of stimulation group by context. Hand angle plotted across stimulation groups (CB = blue, dlPFC = red, SHAM = green) across all trials. Dotted line indicates 45° rotation required to minimize target error to zero. Left: Hand angle during horizontal screen context. Right: Hand angle during vertical screen context. Data points represent epochs of eight movements; shading represents the standard error of the mean for each epoch.

