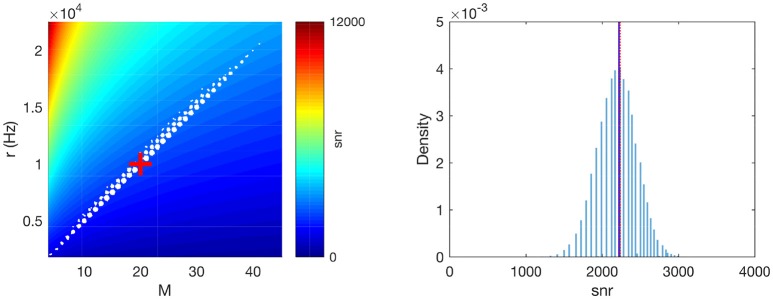
Figure 2.
Numerical validation of the averaging operations. (Left) M×r plane. The white dots correspond to different realizations of a Poisson pattern (a jitter was added to better visualize density, given that both M and r are discrete). The background color shows the corresponding snr. The red cross corresponds to the average-case scenario M = 〉M〈 and r = 〉r〈. (Right) The distribution of snr values across Poisson realizations. The vertical blue solid line shows its average. The vertical red dotted line shows our approximation, , which matches very well the true average. Parameters: P = 1, Δt = 2 ms, f = 1 Hz.

