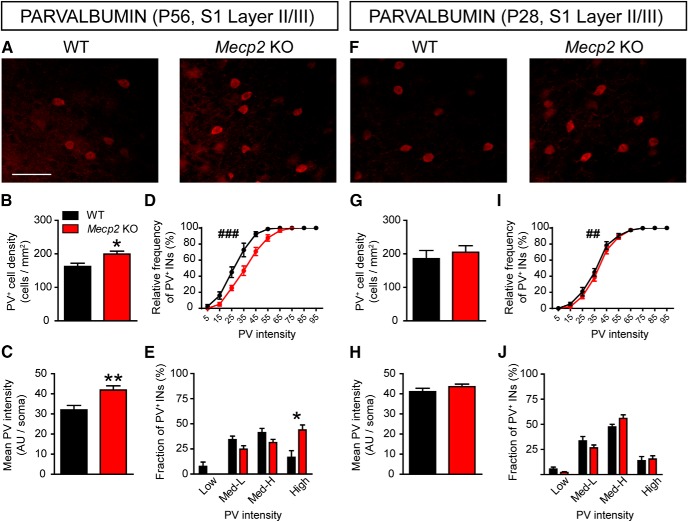
Figure 1.
Atypical high-PV expression in the S1 cortex of Mecp2 KO mice. A, Representative images showing PV labeling in layer II/III of S1 cortex in WT and Mecp2 KO mice at P56. Histograms showing quantitative analysis of PV+ cell density (B), PV mean fluorescence intensity (C), cumulative (D) and binned (E) frequency distribution of PV cells intensity in WT and Mecp2 KO mice at P56. F, Representative images showing PV labeling in layer II/III of S1 cortex in WT and Mecp2 KO mice at P28. Histograms showing quantitative analysis of PV cell density (G), PV mean fluorescence intensity (H), cumulative (I) and binned (J) frequency distribution of PV cells intensity in WT and Mecp2 KO mice at P28. n = 6 mice per genotype. Student’s t test: *p < 0.05, **p < 0.01, Mann–Whitney U test for D, I: ##p < 0.01; ###p < 0.001. Scale bar = 100 μm.

