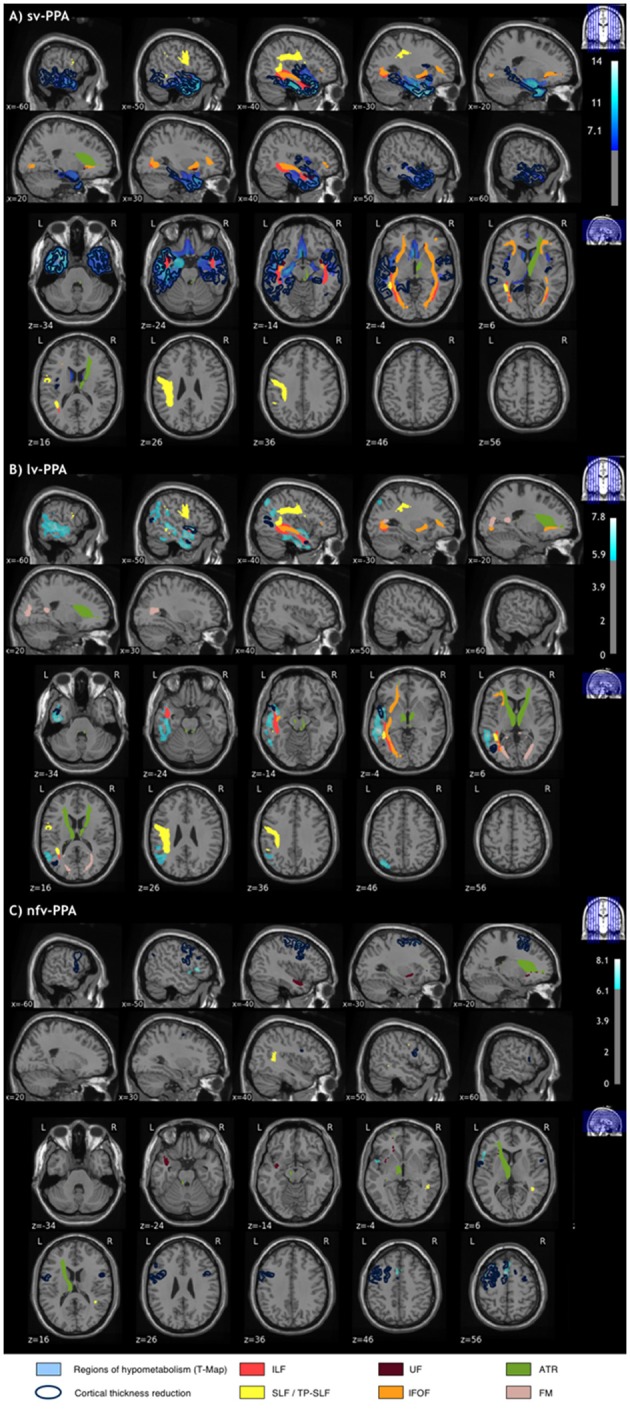
Figure 4.

Alterations across the three imaging modalities (T1-cortical thickness, FDG-PET, DWI-tracts) in (A) sv-PPA (B) lv-PPA (C) nfv-PPA patients, compared to healthy controls. Significantly altered areas correspond to a corrected p-value of 0.05 for all modalities. The correction for multiple comparisons used FWE at vertex-level for T1, FWE at peak-level for PET, and Bonferroni for DWI.
