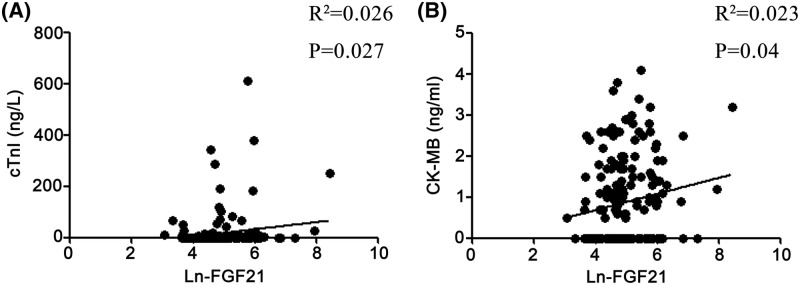
Figure 2. Correlations between FGF21 levels and the concentrations of cTnI and CK-MB in all subjects.
(A) Correlations between FGF21 levels and cTnI, (B) correlations between FGF21 levels and CK-MB. FGF21 was Ln transformed for analysis. Correlation analyses were performed by using Spearman’s correlation analyses.

