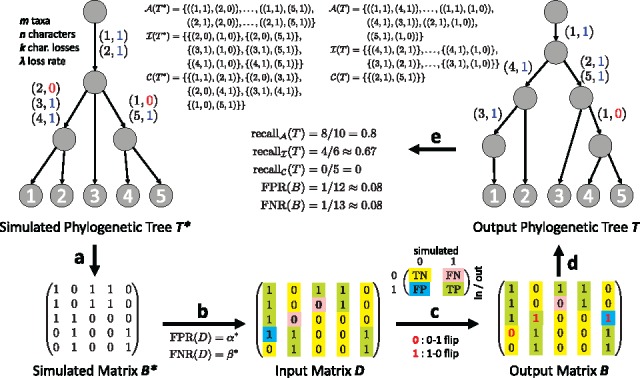
Fig. 3.

Simulation setup and comparison measures. (a) Given the number m of taxa and n of characters, we use the ms package (Hudson, 2002) to simulate a perfect phylogeny tree. Subsequently, we introduce at most k losses per character using a rate λ, yielding the simulated phylogenetic tree and matrix . (b) We then perturb the entries of given a false positive rate and false negative rate , yielding the input matrix . Entry is a true negative (TN) if and a false negative (FN) if . Conversely, is a false positive (FP) if and a true positive (TP) if . (c) Given D, and , a phylogeny estimation method yields output matrix . (d) In addition, such a method outputs a phylogenetic tree T whose leaves form the rows of output matrix B. (e) To compare T and , we compute the recall in terms of pairs of character states that are ancestral (), on distinct branches (incomparable, ), or on the same edge (clustered, ). A recall of 1 for all three measures implies that (the internal nodes of) T and are identical. To compare B and , we compute and —if both are 0 then
