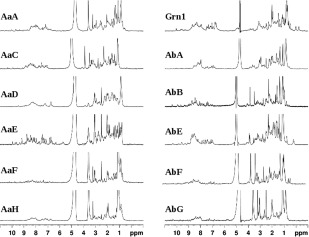
Figure 3.

500 MHz proton NMR spectra of HPLC fractions selected for NMR analyses (see Fig. 2). Most spectra contain a broad spectral feature in between 7.5 and 8.5 ppm, with the exception of AaE and AbB which have well‐dispersed and sharp proton resonances indicating the formation of folded three‐dimensional structures (see the text descriptions for details). Samples of AaG and Grn2 did not produce NMR spectra of sufficient S/N ratio, indicating either aggregation or insufficient amount of purified materials.
