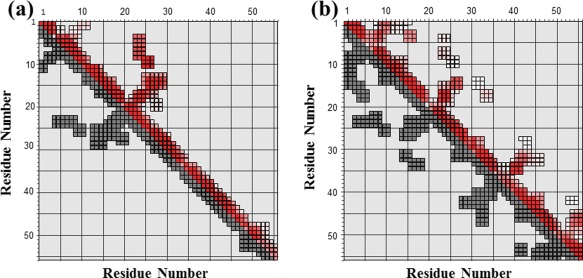
Figure 5.

Diagonal plots of NOE connectivities observed for GEM peptides AbB and AaE. (A) NOE connectivites of AbB indicate medium‐range folding and the formation of two β‐hairpins. (B) NOE connectivities of AaE show the formation of four β‐hairpins and signs of two structural subdomains in the N‐ and C‐terminal region. Input NOE peak lists with chemical shift assignments (lower triangle in black) are plotted (using the Perl script ariaoverview.pl, see Vranken et al.22) against assigned NOE constaints (upper triangle in color). Both axes of the plots represent residue numbers of AbB in (A) and AaE in (B).
