Figure 3.

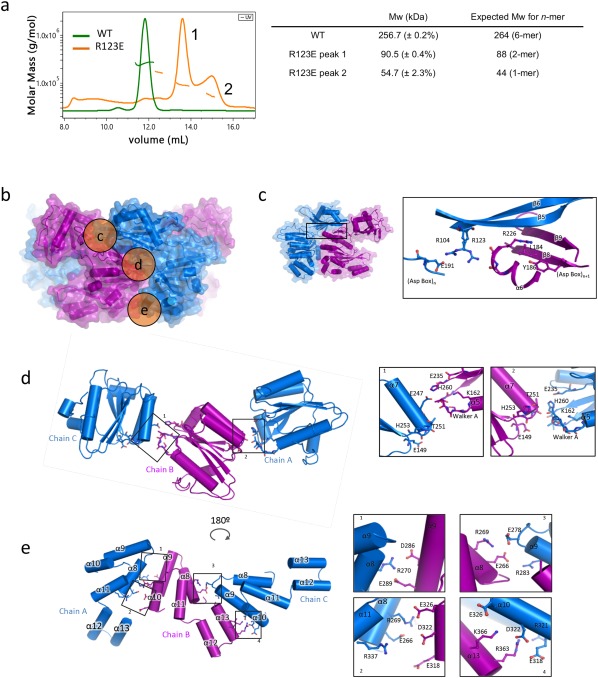
Protein–protein interfaces between subunits. (A) SEC–MALS profiles of the purified DotBL wild‐type (WT in green) and the R123E DotBL mutant (in orange), and the corresponding calculated and expected masses. (B) Locations of three of the DotBL intersubunit interfaces detailed in panels c, d, and e. Side views of two subunits in the α (blue) and β (purple) conformations are shown in stronger colors. The location of the regions described in panels c, d, and e is shown in orange circles labeled correspondingly. (C) NTDn/CTDn +1 interface (region c in panel B). Left: Location of the interface shown at right. The α–β dimer is shown as in B. The box locates the region detailed in the zoom‐in view at right. Right: Close‐up view of the interface. Secondary structure elements and side chains involved in intersubunit contacts are shown in cartoon and stick representation, respectively, and labelled. (D) Upper part of the CTDn/CTDn +1 interface (region d in panel B). Left: Overview of the interface. CTDs of three subunits are in cartoon representation. Side chains involved in intersubunit interactions are shown in stick representation. Boxes indicate the zoom‐in regions shown at right. Right: Close‐up view of the regions shown in boxes. Representation and labeling are as in C. (E) Lower part of the CTDn/CTDn +1 interface (region e in panel B). Left: Overview of the interface. Representation and labeling are as in D. Right: Close‐up view of the regions shown in boxes. Representation and labeling are as in D.
