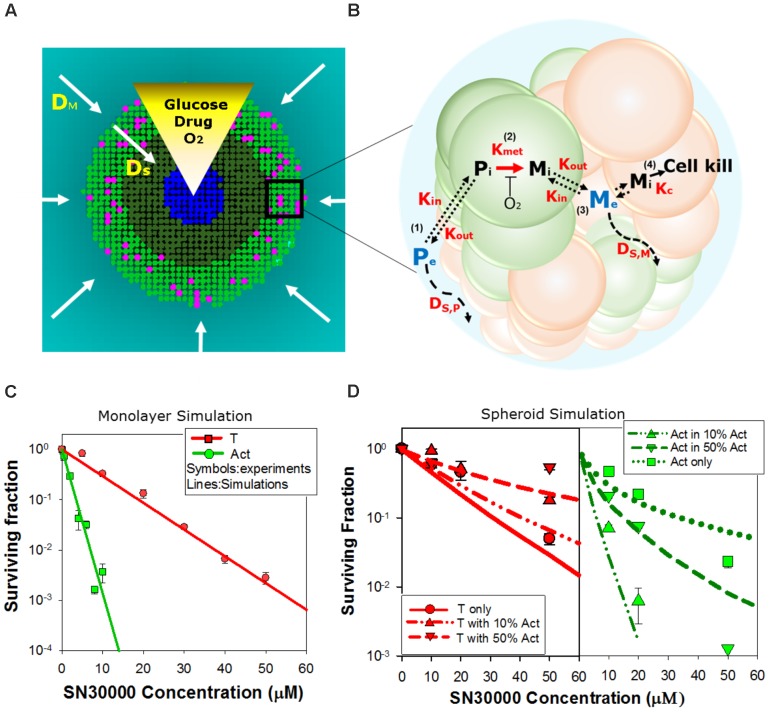
FIGURE 4.
Agent-based model (ABM) of SN30000 diffusion and cytotoxicity in spheroids. (A) The ABM simulates diffusion gradients of oxygen, glucose, drugs and their metabolites in the 3D spheroid and surrounding medium (arrows). In the model, illustrated here as a transverse section through the midplane of a 4-day-old spheroid, these gradients control proliferation (mitotic cells, pink), fraction of hypoxia (O2 < 4 μM, dark green), central necrosis (blue) and cellular response to external stimuli including drug treatment. Diffusion in the unstirred bulk medium and the spheroid are described by diffusion coefficients DM and DS, respectively. If severe hypoxia (O2 < 0.15 μM) persists for more than 24 h, cells are ‘tagged’ for death (blue) and will become necrotic. (B) Schematic diagram illustrating the cellular pharmacokinetic/pharmacodynamic (PKPD) model: (1) extracellular prodrug (Pe) exchanges with intracellular prodrug (Pi) with transfer across the cell membrane determined by the rate constants, Kin and Kout; (2) Pi is metabolized to intracellular cytotoxic metabolite (Mi) in activators (green) with first order rate constant Kmet; (3) Mi may efflux from cells to initiate bystander killing via uptake by surrounding target cells (red); (4) cell kill probability is a compound-specific function of exposure to Mi and potency of Mi (Kc). (C,D) Model predictions of clonogenic survival of activators (Act; POR-R) and targets (T; PORko-G) in monolayer cultures (C) or spheroids (D) after SN30000 treatment under anoxia. Lines are simulation outputs and symbols are measured values (redrawn from Figures 1D, 3B, respectively).

