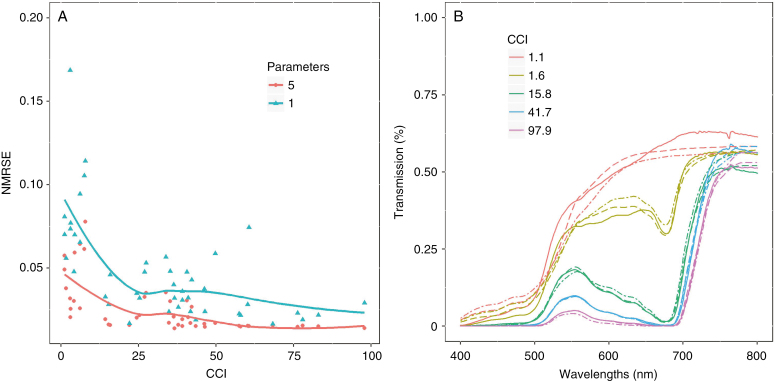
Fig. 3.
Comparison of model accuracy before and after reducing the amount of parameters in the PROSPECT-D model. (A) Normalized mean-root-square error (NMRSE) between the measured and simulated transmission spectrum with the PROSPECT-D model for each sample in the calibration set. The red line represents the model error after calibration of all five selected PROSPECT-D parameters, and the blue line represents the model error after reducing the model to a single input parameter (i.e. the CCI). (B) Visual representation of the measured transmission spectra of five point measurements (solid lines) with a vastly different chlorophyll content index (CCI), their fitted transmission spectrum after optimization with five PROSPECT-D parameters (dashed lines) and after prediction using only the CCI (dot-dashed lines).

