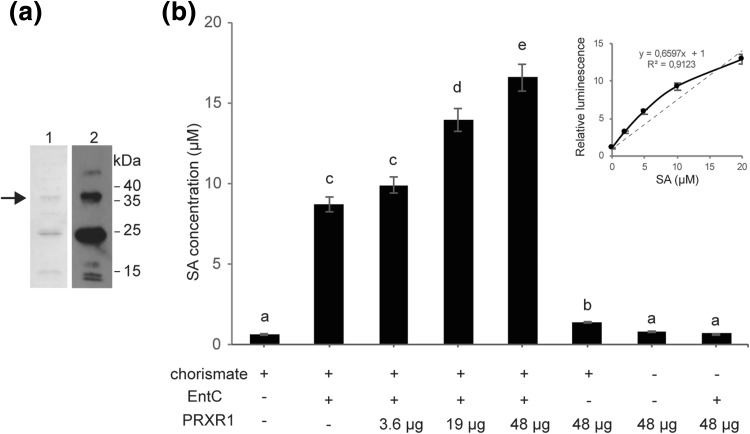
Fig. 6.
SA production in vitro with recombinant His-tagged PRXR1. a His-tagged PRXR1 protein was expressed in E. coli, purified and analyzed using SDS-PAGE and either stained with Coomassie Brilliant Blue (lane 1) or visualized with Western blotting using anti-His antibodies (lane 2). The positions of molecular mass markers are indicated in kDa. The arrow indicates the position of the recombinant PRXR1 protein band. b Production of SA in vitro, as measured with the Acinetobacter biosensor. Letters indicate significantly different groups (P < 0.05). Error bars represent the mean ± SE (n = 3). This experiment was repeated three times with similar results. The inset shows the calibration curve used for converting luminescence values to SA concentrations

