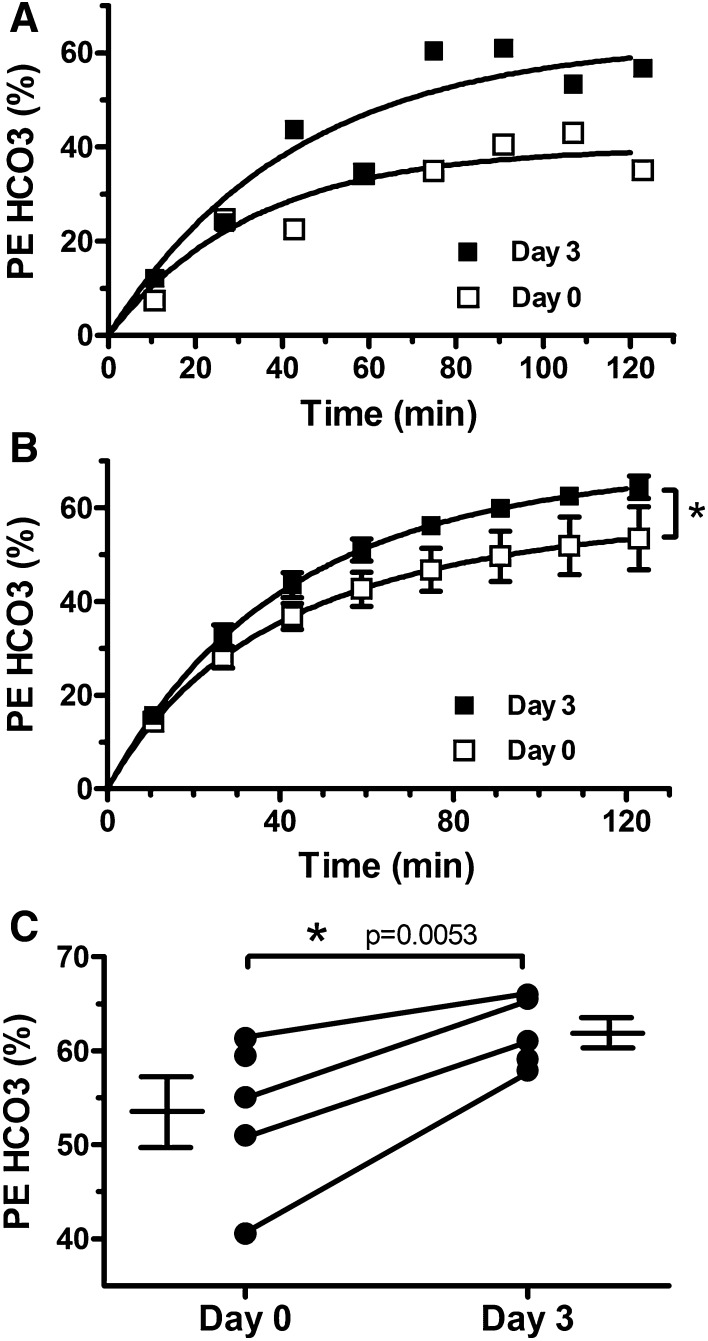
Fig. 1.
Glial acetate metabolism (GAM) is increased following a 72-h fast. GAM was measured via carbon 13 magnetic resonance spectroscopy during [1-13C] acetate infusion. a Time course of the percent enhancement (PE) of 13C bicarbonate (HCO3; the primary metabolite of [1-13C] acetate oxidation) following the start of infusion in a representative subject after 12 h of fasting (day 0) and 72 h of fasting (day 3). The solid line represents the best fit of a mono-exponential function modeling GAM. b Comparison of the average best fit across subjects via a linear mixed effects model demonstrates a clear increase from day 0 to 3 (p < 0.0001). c Average steady-state PE of HCO3 was increased on day 3 relative to day 0 (p = 0.0053). Furthermore, the PE of HCO3 was increased on day 3 relative to day 0 in all subjects who completed both scans (symbols with connecting lines)

